FIGURE 4.
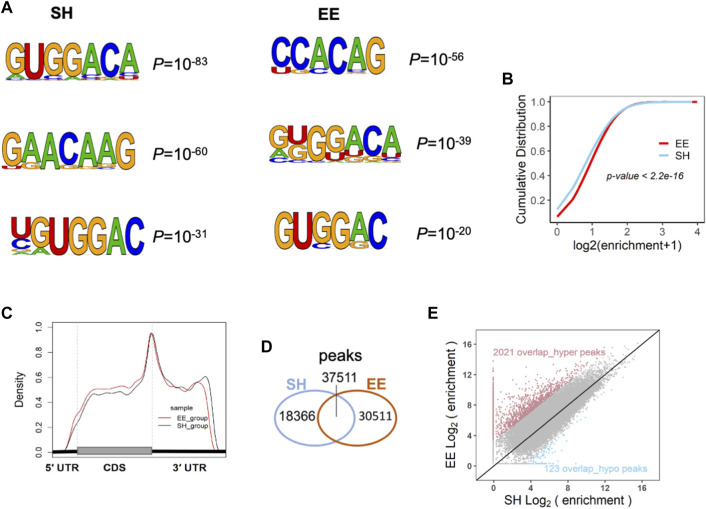
Enriched environment exposure alters the transcriptome-wide distribution of m6A. (A) MeRIP-seq data analysis revealed the sequence motif of m6A modification in SH and EE groups. (B) Cumulative distribution of m6A abundance (log2(enrichment folds+1)) in SH (blue line) and EE (red line) groups. p value was calculated using the two-sided Wilcoxon and Mann–Whitney test. (C) The distribution pattern of m6A modification in the transcriptome of the hippocampal tissues of SH and EE mice. m6A tag was significantly enriched around the stop codon of mRNAs. (D) Venn diagram illustrating the specific and overlapped m6A peaks in the transcriptome of the hippocampal tissues of SH and EE mice. (E) Scatterplot showing the differential m6A enrichment of the overlapped peaks between SH and EE groups, including 2021 hyper-methylated peaks (red dots) and 123 hypo-methylated peaks (blue dots) in the EE group.

