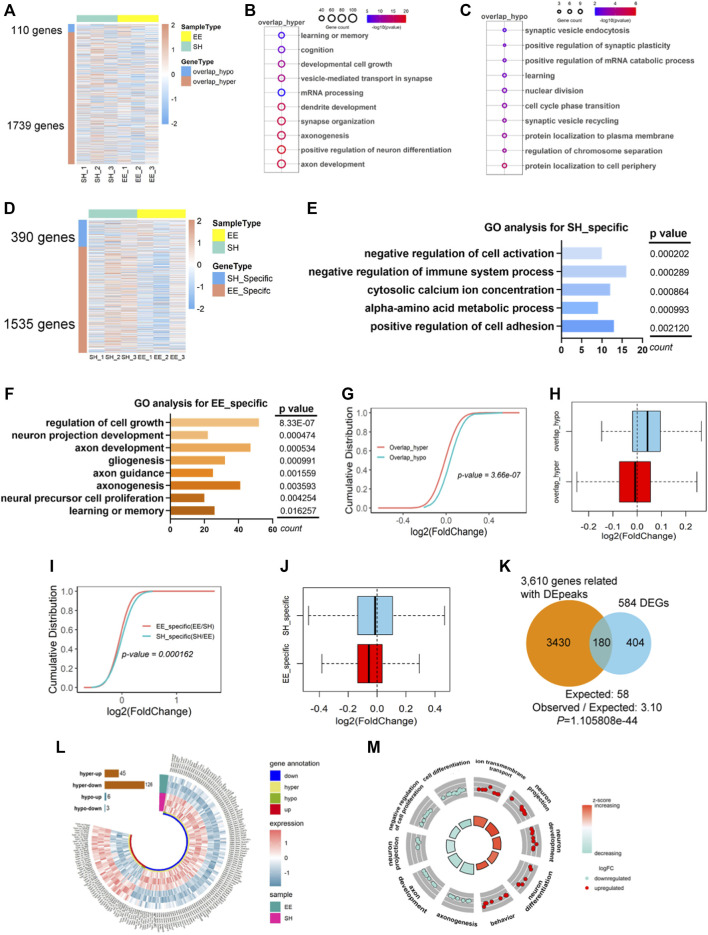
FIGURE 5.
Differentially expressed transcripts with differential m6A modification involve in neuronal development. (A) Heatmap illustrating the 110 overlapped hypo-m6A (overlap_hypo) and 1739 hyper-m6A (overlap_hyper) peaks associated genes respectively. Three biological repeating hippocampal samples of SH and EE mice were adopted, respectively. (B,C) GO analysis shows that the functional enrichment of overlap_hyper- (B) and overlap_hypo-peaks (C) associated genes enriched learning and memory, synaptic development, and axon development. (D) Heatmap illustrating the 390 genes related to SH specific m6A peaks and 1535 genes related to EE specific m6A peaks. Three biological repeating hippocampal samples of SH and EE mice were adopted, respectively. (E) Top GO biological terms of specific m6A peaks associated genes in the SH group. Results show these genes were enriched in negative regulation of cell activation, metabolic process, and cell adhesion. (F) Top GO biological terms of specific m6A peaks associated genes in EE group. Results show these genes were enriched in the regulation of cell growth, neuronal development, axon development, and learning. (G,H) Cumulative curves (G) and box plot (H) of log2(fold change of gene expression). The red line and box plot show the expression of overlap_hyper-m6A methylation peaks associated with genes in SH and EE groups. The greenline and box plot show the expression of overlap_hypo-m6A methylation peaks associated with genes in SH and EE groups. (I,J) Cumulative curves (I) and box plot (J) of log2(fold change of gene expression). The green line and box plot shows SH-specific m6A peaks associated with genes. Redline and box plot show EE-specific m6A peaks associated with genes. (K) Venn diagram showing the overlapped genes between differential m6A peaks (including overlap_hyper, overlap_hypo, and SH/EE specific peaks) associated genes and differentially expressed genes (DEGs). p values were calculated by a hypergeometric test. (L) Circos plot showing the distribution of hyper-up, hyper-down, hypo-up, and hypo-down associated genes in EE group compared to SH group. hyper, including EE specific and overlap_hyper m6A peaks in EE group; hypo, including SH specific and overlap_hypo m6A peaks in EE group. (M) GO Circle visualization of 10 of the most relevant functional categories related to neurodevelopment and learning (five hyper-up regulated and five hyper-down regulated) in the EE group versus SH. The outer circle shows the log2 fold change (FC) of the genes in each category, the height of the inner bar plot indicates the significance level of the GO term (−log10(FDR)), and the color represents the Z score.

