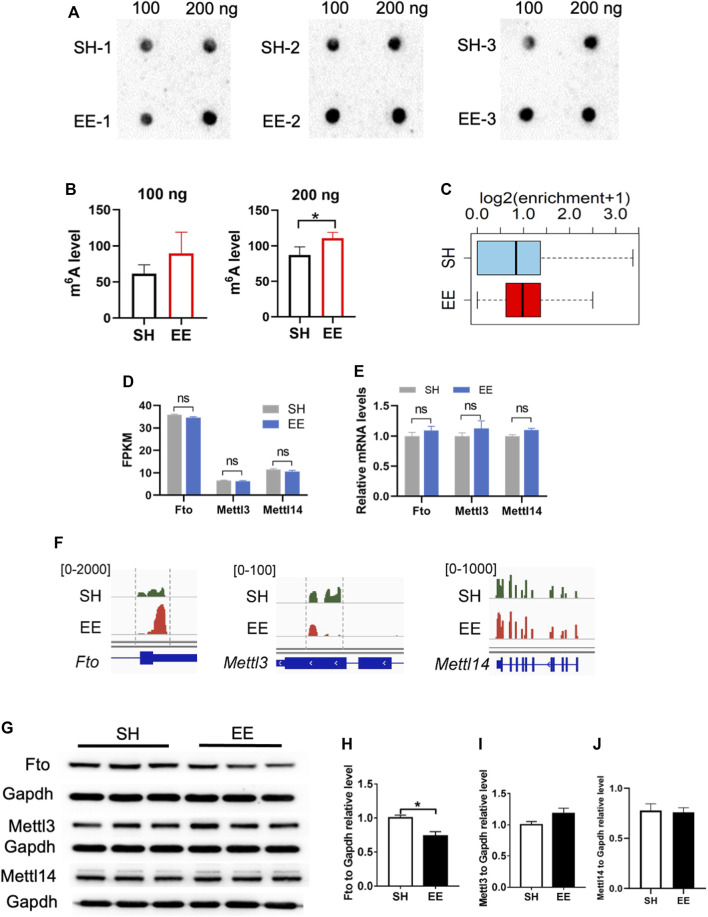
FIGURE 6.
Fto involves in EE exposure-induced differential m6A modification. (A,B) m6A dot blot and quantification results showed that EE exposure induced a decrease of global m6A level compared to that of SH mice. n = 3 independent experiments. Values represent mean ± SEM; *p < 0.05; **p < 0.01; ***p < 0.001; unpaired Students t test. (C) Box plot of (log2(enrichment +1)) in SH (blue box) and EE (red box) groups. p value was calculated using two-sided Wilcoxon and Mann–Whitney test. (D) FPKM values of m6A writers Mettl3, Mettl14, and Fto. Values represent mean ± SEM; ns, not significant; *p < 0.05; **p < 0.01; ***p < 0.001; unpaired Students t test. (E) qRT-PCR results showing the expression of m6A writers Mettl3, Mettl14, and Fto. n = 3 independent experiments. Values represent mean ± SEM; ns, not significant; *p < 0.05; **p < 0.01; ***p < 0.001; unpaired Students t test. (F) IGV screenshots showing the altered m6A modification on Fto, Mettl3 and Mettl14 hypermethylation in EE compared to SH in the 3′ UTR of Fto. (G–J) Representative Western blot images (G) and quantification results (H–J) showed that EE exposure led to a decrease of FTO protein, whereas the levels of METTL3 and METTL14 were not changed. n = 3 independent experiments. Values represent mean ± SEM; ns, not significant; *p < 0.05; **p < 0.01; ***p < 0.001; unpaired Students t test.

