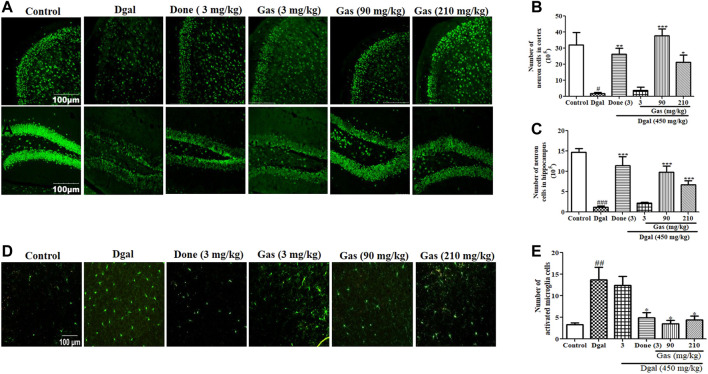
FIGURE 3.
Gas promotes neuroprotection and mitigates microglial activation in Dgal-induced AD mice. (A) Fluorescent image of neurons in the hippocampus and cerebral cortex of all groups. (B) and (C) represent digital number of neurons in the cerebral cortex and hippocampus, respectively. (D) Fluorescent image of microglia in the cerebral cortex. (E) Digital number of microglia in the cerebral cortex. The brains of three mice in each group were cut, and six sections of the cerebral cortex and hippocampus of each mouse were used to calculate neurons or microglia. The data were presented as means ± SEM. ## and ### indicate significant differences at p < 0.01 and p < 0.001 compared with those of the normal control, respectively; *, **, and *** indicate significant difference at p < 0.05, p < 0.01, and p < 0.001 compared with those of the Dgal group, respectively.

