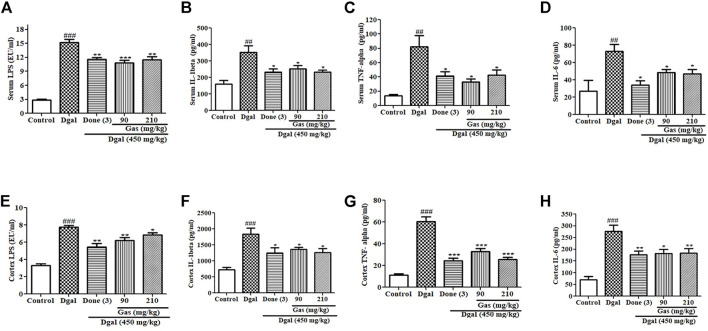
FIGURE 4.
Effects of Gas on proinflammatory cytokines in the serum and cerebral cortex. (A–D) Changes in the serum LPS, IL-1β, TNF-α, and IL-6 of AD mice after treatment with Gas, respectively. (E–H) Concentration of cerebral cortex LPS, IL-1β, TNF-α, and IL6. Sample numbers are five, and the data are presented as means ± SEM. #, ##, and ### indicate significant differences at p < 0.05, p < 0.01, and p < 0.001 compared with those in the normal control, respectively; *, **, and *** indicate significant difference at p < 0.05, p < 0.01, and p < 0.001 compared with those of the Dgal group, respectively.

