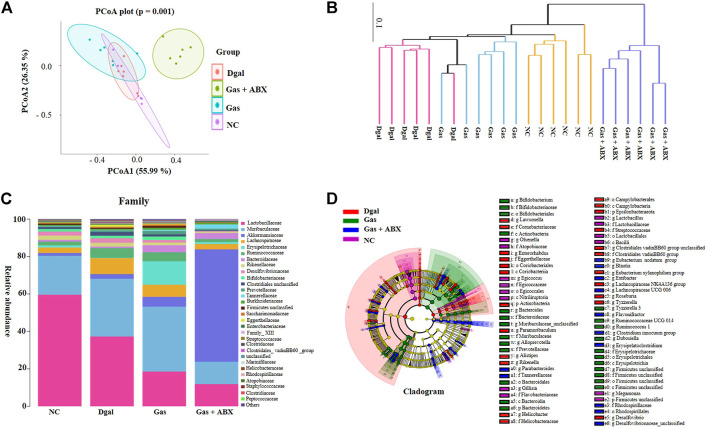
FIGURE 7.
Effects of Gas and antibiotics cocktail on the gut microbiota composition of AD mice. (A) PCoA of gut microbiota in all groups. (B) UPGMA tree of gut microbiota in all experimental groups. (C) Stacked bar chart of the relative abundance of gut microbiota at the family level. (D) Cladogram of gut microbiota in all groups.

