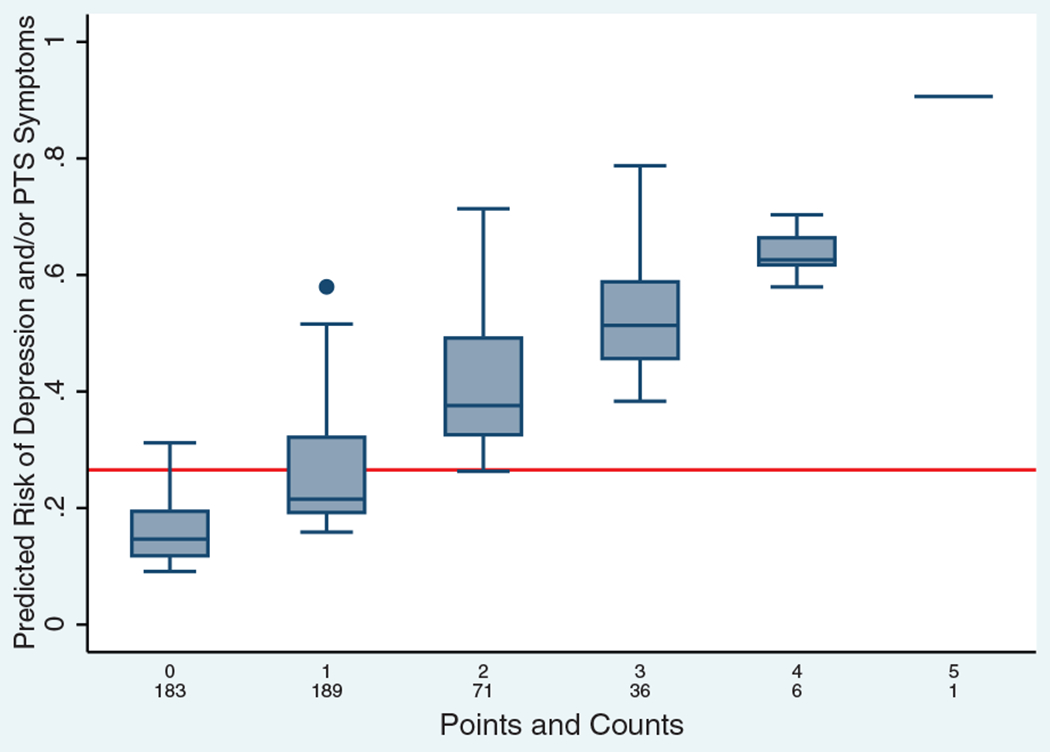
Figure 2.

Risk of developing depression and/or posttraumatic stress symptoms by risk score. The x-axis is each possible point sum with the count for each point sum below it. The bar in the middle of each box represents the median predicted risk, and the top and bottom of the box are the 75th and 25th percentiles of the distribution, respectively. The whiskers cover 1.5 times the difference between the 25th and 75th percentiles, and the dots represent values that are outside of this range. The horizontal line indicates the prevalence of depression and/or posttraumatic stress symptoms among the study population (26.6%).
