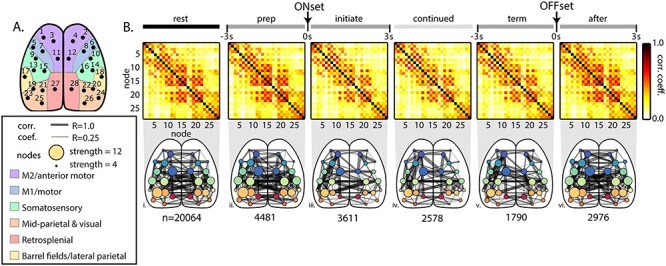
Figure 5.

Functional connectivity among the common cortical nodes during behavior periods across all mice. (A) Diagram of nodes common to the catalog ICs across mice mapped onto the Common Coordinate Framework (Allen Institute for Brain Science 2015). (B) Top: Averaged correlation matrices between nodes across all mice. Bottom: Graphical representation of the correlation matrices shown above superimposed on the dorsal cortical surface. Width of connecting edges indicates the Pearson correlation coefficient (ρ ≥ 0.25). The size of the node reflects the strength; that is, the sum of all correlations with that node. n = number of 3-s time periods included in each behavior period across animals.
