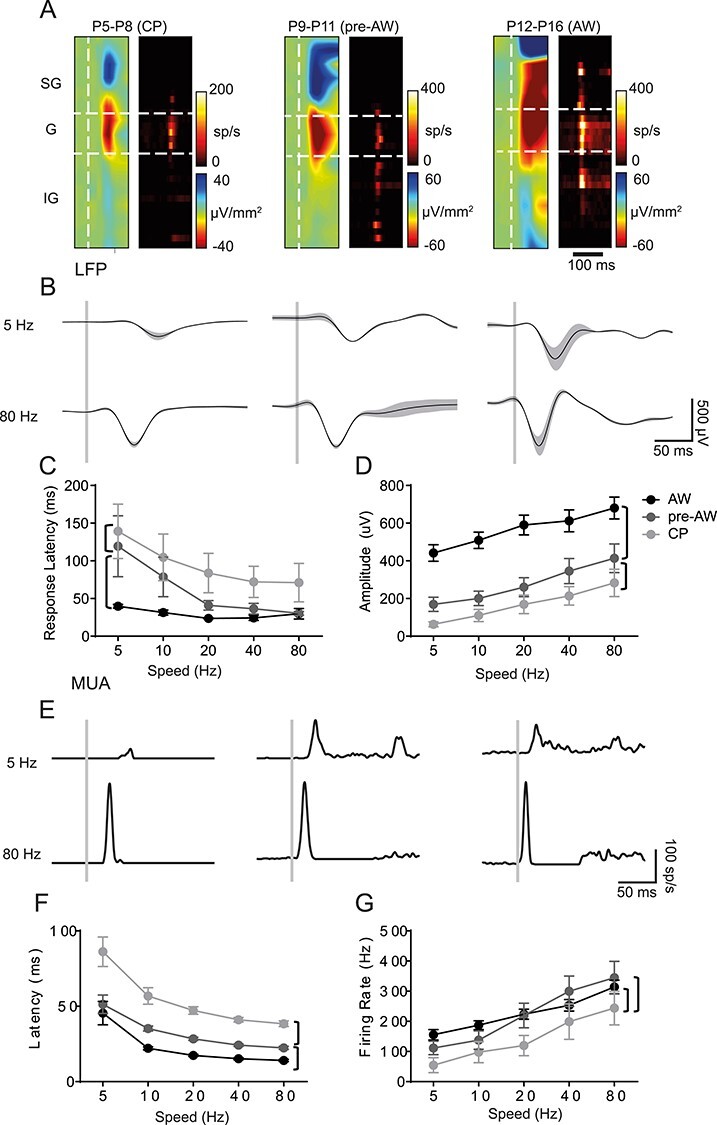
Figure 1 .

SER amplitude increases through development. (A) CSD and MUA plots across the depth of the cortex after a single multi-whisker deflection (indicated by vertical white dashed line in the CSD), during CP (P5-P8), pre-AW (P9-P13), and AW (P14-P21); SG, supragranular; G, granular; IG, infragranular layers. (B) Corresponding granular layer LFP responses after a 5 Hz (top) or 80 Hz (bottom) whisker deflection (onset indicated by vertical gray bar). (C) Plot of the average LFP response latency for the different deflection speeds across the three developmental time periods tested. There was a significant effect (two-way ANOVA) for both age (F(2,188) = 22.19, P < 0.01) and speed (F(4,188) = 5.801, P < 0.01). (D) Plot of average LFP response amplitude for the different deflection speeds across development. There was a significant effect for age (F(2,188) = 75.92, P < 0.01) and speed (F(4,188) = 7.135, P < 0.01). (E) Granular layer MUA responses in the aforementioned time periods after a 5 or 80 Hz whisker deflection. (F) Average MUA response latencies across the developmental time-periods; there was a significant change with speed (F(4,159) = 25.27, P < 0.01) and with age (F(2,159) =63.59, P < 0.01). (G) Average MUA response peak firing rates across the developmental time-periods; we observed a significant change with speed (F(4,159) = 17.51, P < 0.01) and with age (F(2,159) =11.16, P < 0.01). LFP: CP: N = 11, pre-AW: N = 9, AW: N = 21; MUA: CP: N = 8, pre-AW: N = 6, AW: N = 21. Brackets: P < 0.05 post hoc student’s t-test between age groups.
