Figure 2 .

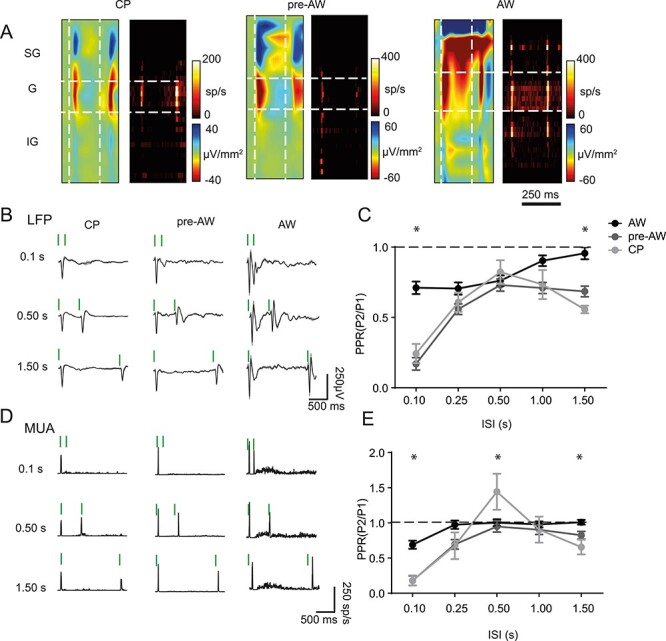
The profile of paired pulse adaptation changes through postnatal development. (A) CSD and MUA plots showing the sensory response across the depth of the cortex after two deflections with a 0.25 s ISI, during CP, pre-AW, and AW. (B) Granular layer LFP responses during the different time-periods for two deflections with ISIs of 0.1, 0.50, and 1.50s; vertical green bars indicate whisker deflection. (C) Plot of average PPR of the LFP response in the granular layer during CP, pre-AW, AW for ISIs of 0.10, 0.25, 0.50, 1.00, and 1.50 s. There was a significant age/ISI interaction (F(8, 307) = 3.272, P < 0.001; CP: N = 22, pre-AW: N = 25, AW: N = 20). (D) Granular layer MUA responses during the different time-periods for 2 deflections with ISIs of 0.1 s, 0.50s, and 1.50s. (E) Average PPR of the MUA response in the granular layer during CP, pre-AW, AW for ISIs of 0.10, 0.25, 0.50, 1.00, and 1.50 s. There was a significant age/ISI interaction (F(8, 198) = 3.876, P < 0.001; CP: N = 12, pre-AW: N = 16, AW: N = 18). * P < 0.05 in post hoc student’s t-test.
