
Figure 5 .
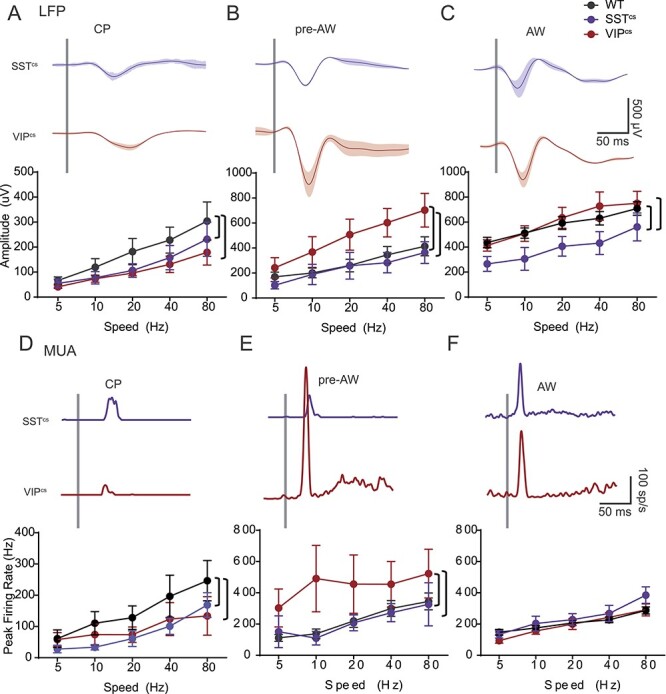
Age-dependent effect of SST+ and VIP+ IN silencing on granular sensory evoked response (SER). (A) Top: LFP response after an 80 Hz deflection in the granular layer of SSTcs and VIPcs animals during CP. Bottom: the average peak amplitude of WT (n = 11), SSTcs (n = 7) and VIPcs (n = 6) animals during CP. There was a significant effect for speed (F(4,98) = 6.743, P < 0.001) and genotype (F(2,98) = 3.665, P < 0.05). (B) Top: Corresponding data for WT (n = 9), SSTcs (n = 5) and VIPcs (n = 6) animals during pre-AW. There was a significant effects for speed (F(4,85) = 6.737, P < 0.001) and genotype (F(2,85) = 11.59, P < 0.001). (C) Corresponding data for WT (n = 21), SSTcs (n = 6) and VIPcs (n = 6) animals during AW. There was a significant effects for speed (F(4,152) = 7.205, P < 0.001) but not for genotype (F(2,152) = 9.600, P < 0.001). (D) Top: MUA response after an 80 Hz deflection in the granular layer of SSTcs and VIPcs animals during CP. Bottom: average peak firing-rate of WT (n = 8), SSTcs (n = 5) and VIPcs (n = 5) animals during CP. There was an effect for speed (F(4,70) = 4.58, P < 0.001), and genotype (F(2,70) = 3.834, P < 0.05). (E) Top: Corresponding MUA data for L4 in SSTcs and VIPcs animals during pre-AW. Bottom: average data for WT (n = 6), SSTcs (n = 4) and VIPcs (n = 6) animals; there was no effect for speed ((4,60) = 1.650, P = 0.0.173), but there was an effect for genotype (F(2,60) = 7.208, P < 0.01). (F) Top: MUA response in the granular layer of SSTcs and VIPcs animals during AW. Bottom: average peak firing-rate of WT (n = 21), SSTcs (n = 6) and VIPcs (n = 6) animals during AW. There was an effect for speed (F(4,147) = 16.81, P < 0.001), but not for genotype (F(2,147) = 2.404, P = 0.094). Brackets show a P < 0.05 in a post hoc student’s t-test.