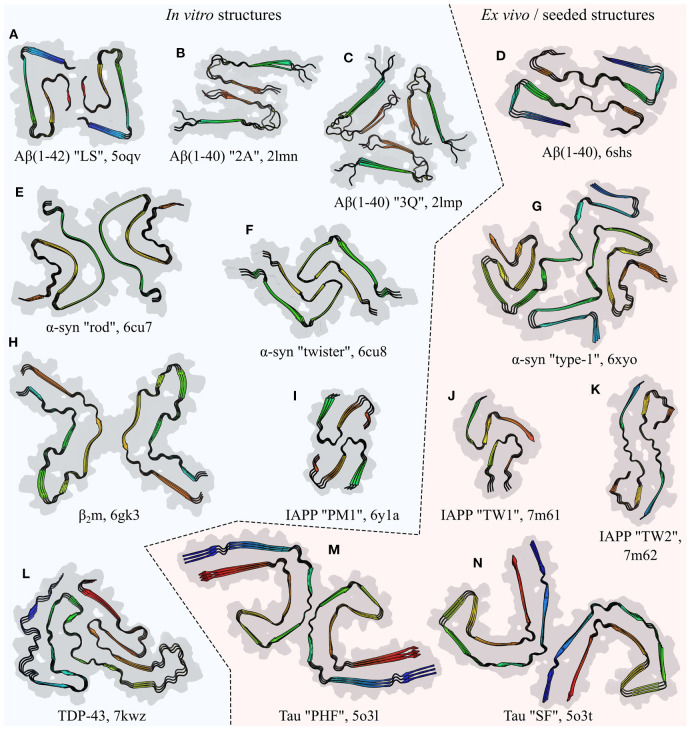
Figure 5.
Comparison of the folds of amyloid fibril subunits, illustrated by examples from six polypeptides: amyloid-β (Aβ; Paravastu et al., 2008; Gremer et al., 2017; Kollmer et al., 2019), α-synuclein (α-syn; Li et al., 2018a; Schweighauser et al., 2020), β2-microglobulin (β2m; Iadanza et al., 2018b), islet amyloid polypeptide (IAPP; Röder et al., 2020; Cao et al., 2021), TDP-43 (Li et al., 2021), and Tau (Fitzpatrick et al., 2017). The name of the polypeptide is given below each structure, alongside the polymorph in quotes where relevant, and the PDB ID. Each structure is a stack of three subunit layers, viewed from a perspective facing down the fibril axis and using the same scale for all panels. Structures are composites of the surface (gray) and ribbon diagram (colored) representations, with the color of the latter varying spectrally from the N-terminus (blue) to the C-terminus (red); the true termini are used for spectral coloring of (A–K), whereas the ends of the structured segments are used for (L–N). Unstructured segments are not shown. Fibrils produced entirely in vitro are shown on the left of the central dashed line, while those extracted (D,G,M,N) or seeded (J,K) from living tissue are shown on the right.

