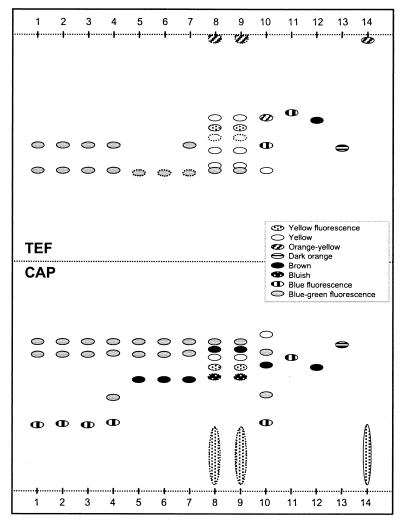
FIG. 2.
Schematic illustration of secondary metabolite profiles. TLC plates were eluted in toluene-ethyl acetate-formic acid (TEF) and chloroform-acetone-isopropanol (CAP) and evaluated under UV light (365 nm). Lanes: 1, P. roqueforti SVA 3631/1996, having a T in position 180 of the ITS1 region; 2, P. roqueforti SVA 8176/1995, isolate 5 (A in position 180); 3, P. roqueforti SVA 2986/1992 (T in position 180); 4, P. roqueforti type strain (IBT 6754); 5, P. paneum SVA 494/1990; 6, P. paneum SVA 7023/1994, isolate 2; 7, P. paneum type strain (IBT 12407); 8, P. expansum SVA 2294/1994, isolate 5; 9, P. expansum SVA 6180/1994, isolate 1; 10, P. carneum type strain (IBT 6884). Lanes 11 to 14 are standards: griseofulvin (11), patulin (12), PR toxin (13), and roquefortine C (14). Dotted lines around spots indicate weak spots.

