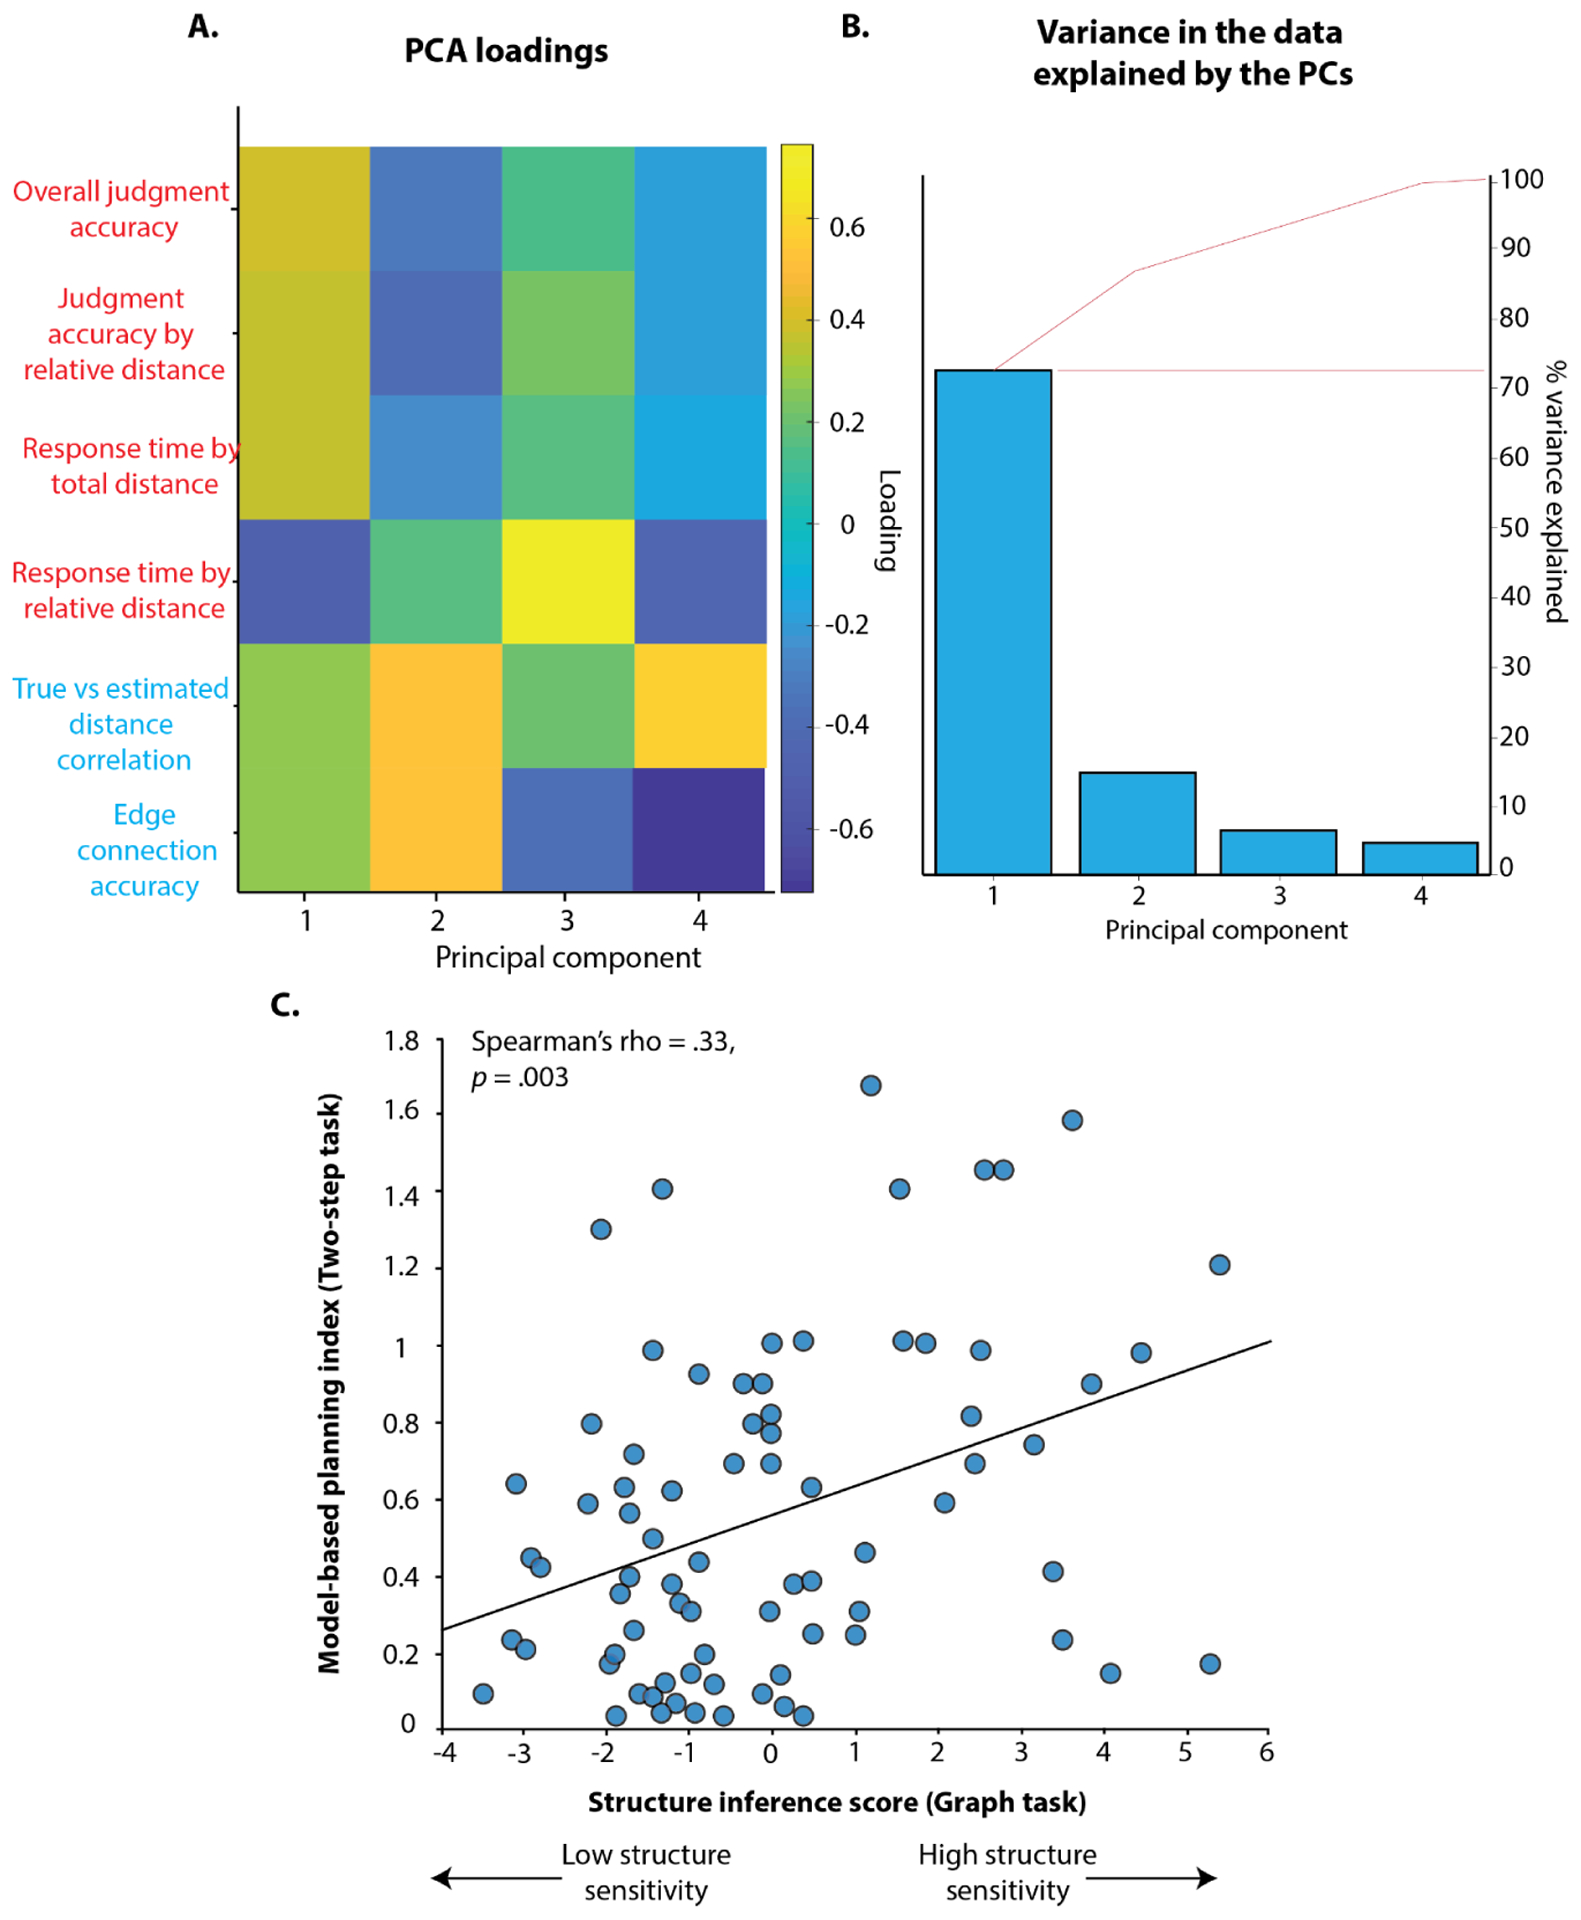
Figure 6.

Plot A shows the PC loadings on all 6 graph-task measures (red = relative distance judgment task measures; blue = graph reconstruction measures). First component loads on all 6 measures, whereas the second component is selective for graph reconstruction measures. Eigenvalue of the first component is 4.33, and the second component is 0.85. Plot B shows the percentage of variance captured by different components. The first component (structure inference ability PC) captures the majority of variance (72%). Plot C shows that latent factor capturing structure inference ability (PCA score) is positively correlated with model-based planning (model-based weights βMB) across individuals.
