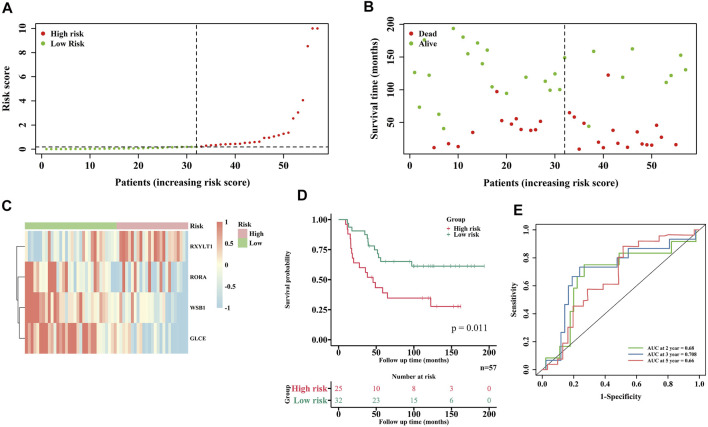
FIGURE 4.
Validation of the risk model in the ICGC cohort. (A) Distribution of EWS patients in ICGC cohort based on the risk score formula. (B) Survival status of each EWS patient. (C) Heatmap of 4 HRGs expressions in two risk groups. (D) KM curves for comparison of the overall survival in two risk groups. (E) ROC curves showed the predictive efficiency of the risk model.

