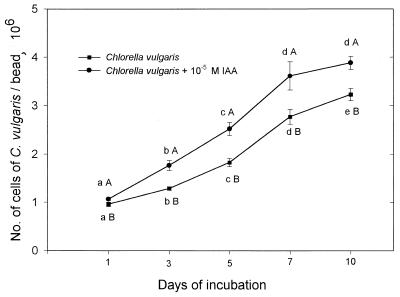
FIG. 4.
The effect of addition of IAA (10−4, 10−5, and 10−6 M) on C. vulgaris growth in batch culture. Points on each curve denoted by a different lowercase letter differ significantly at P ≤ 0.05 in one-way ANOVA. Points denoted by different capital letters after each day of incubation differ significantly at P ≤ 0.05 in Student's t test. Bars represent the SE. When the SE bar is absent, the SE is smaller than the point.

