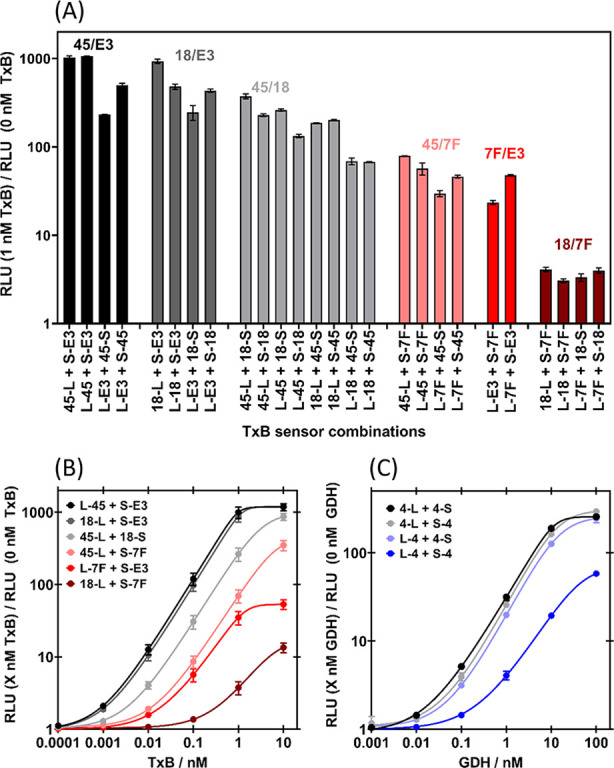
Figure 2.

Establishing optimal sensor protein combinations. (A) Fold gain in bioluminescence of TxB sensor proteins with 1 nM TxB vs 0 nM TxB. Luminescence was read immediately after substrate addition and data are the mean of duplicates on the same plate. Different colors indicate different binding protein pairs. (B) Dose response of TxB sensor proteins. Luminescence was read 4 min after substrate addition and data are the mean of three independent measurements. (C) Dose response of GDH sensor proteins. Luminescence was read 4 min after substrate addition and data are the mean of two sets of duplicates from two independent experiments. For all assays, analyte (final concentration indicated) and sensor proteins (final concentration = 2 nM each) were incubated for 30 min, at 25 °C, with agitation prior to addition of Nano-Glo substrate to a final dilution of 1:1000. Error bars indicate standard deviation from the mean and solid lines are 5PL regression fits (B: 0.970 < R2 < 0.987 and C: 0.990 < R2 < 0.999).
