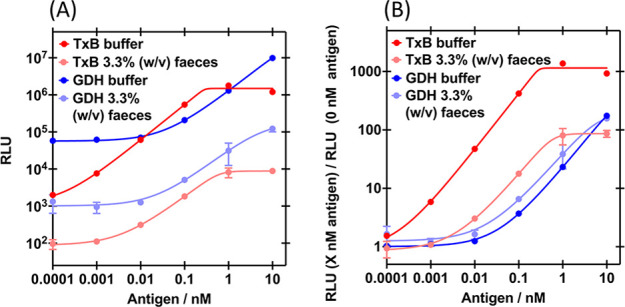
Figure 5.

Effect of feces on the split-luciferase assay dose response curves. (A) Bioluminescence and (B) fold gain in bioluminescence of 0.5 nM S-E3 + 1 nM L-45 or 8 nM 4-S + 8 nM 4-L, with TxB or GDH, respectively, in the presence of 0 or 3.33% w/v feces. Sensor proteins (final concentration in the assay indicated) and analyte (final concentration in the assay indicated) incubated with C. difficile negative fecal sample or buffer for 30 min, at 25 °C, with agitation. Nano-Glo added to a final concentration of 1:1000 and bioluminescence read after 2 min. Data are the mean of duplicates on the same plate, error bars indicate standard deviation from the mean and solid lines are 5PL regression fits (A: 0.939 < R2 < 0.993 and B: 0.939 < R2 < 1.000).
