
TABLE 7.
Pharmacophore Models 3, 4, 5, 6, 7, and corresponding graphic representations, pharmacophoric features, spatial coordinates and number of compounds retrieved in each virtual screening campaign using Molport database.
| Graphic representation | Pharmacophoric features | Spatial coordinates | Number of compounds obtained | |||
|---|---|---|---|---|---|---|
| x | y | z | R | |||
| Model 3 | ||||||
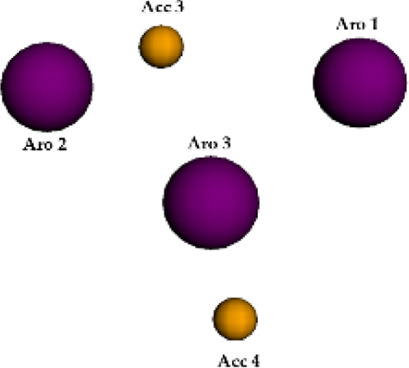
|
Acc 3 | 15.205 | −15.655 | 2.057 | 0.5 | 991 |
| Acc 4 | 16.838 | −21.912 | 1.729 | 0.5 | ||
| Aro 1 | 19.831 | −16.492 | −1.023 | 1.1 | ||
| Aro 2 | 12.488 | −16.602 | −0.420 | 1.1 | ||
| Aro 3 | 16.316 | −19.305 | 0.830 | 1.1 | ||
| Model 4 | ||||||
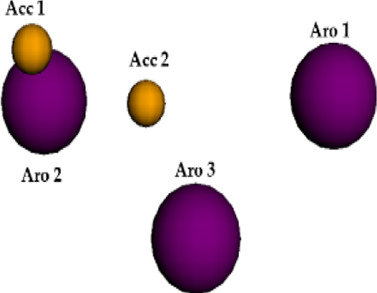
|
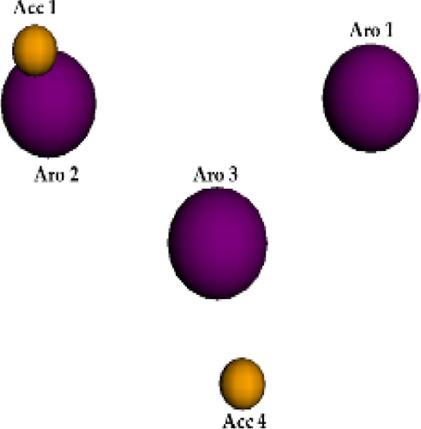
Acc 1 | 12.380 | −15.578 | 2.204 | 0.5 | 129 |
| Acc 2 | 15.069 | −16.653 | −1.457 | 0.5 | ||
| Aro 1 | 19.831 | −16.492 | −1.023 | 1.1 | ||
| Aro 2 | 12.488 | −16.602 | −0.420 | 1.1 | ||
| Aro 3 | 16.316 | −19.305 | 0.830 | 1.1 | ||
| Model 5 | ||||||
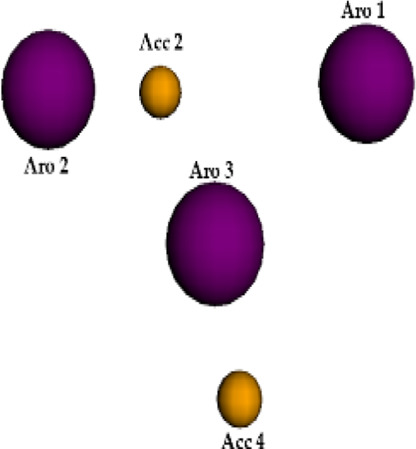
|
Acc 2 | 15.069 | −16.653 | −1.457 | 0.5 | 264 |
| Acc 4 | 16.838 | −21.912 | 1.729 | 0.5 | ||
| Aro 1 | 19.831 | −16.492 | −1.023 | 1.1 | ||
| Aro 2 | 12.488 | −16.602 | −0.420 | 1.1 | ||
| Aro 3 | 16.316 | −19.305 | 0.830 | 1.1 | ||
| Model 6 | ||||||
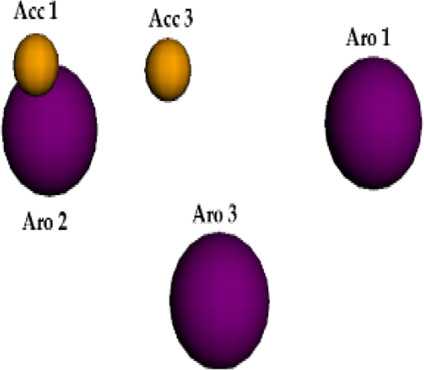
|
Acc 1 | 12.380 | −15.578 | 2.204 | 0.5 | 217 |
| Acc 3 | 15.205 | −15.655 | 2.057 | 0.5 | ||
| Aro 1 | 19.831 | −16.492 | −1.023 | 1.1 | ||
| Aro 2 | 12.488 | −16.602 | −0.420 | 1.1 | ||
| Aro 3 | 16.316 | −19.305 | 0.830 | 1.1 | ||
| Model 7 | ||||||
|
Acc 1 | 12.380 | −15.578 | 2.204 | 0.5 | 731 |
| Acc 4 | 16.838 | −21.912 | 1.729 | 0.5 | ||
| Aro 1 | 19.831 | −16.492 | −1.023 | 1.1 | ||
| Aro 2 | 12.488 | −16.602 | −0.420 | 1.1 | ||
| Aro 3 | 16.316 | −19.305 | 0.830 | 1.1 | ||
| Total | 2332 | |||||