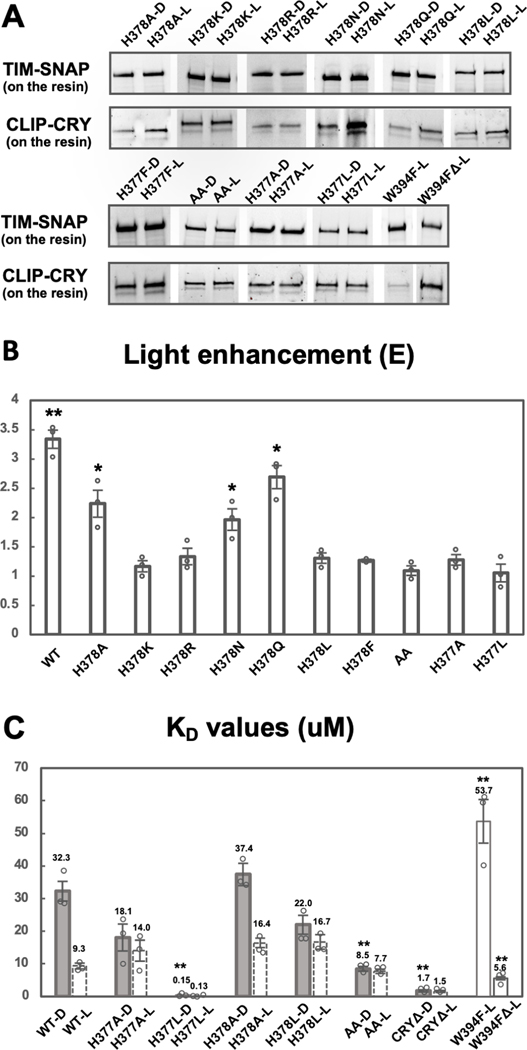
Figure 3: His377 and His378 are key residues for gating the CRY-TIM interaction.
(A) SWFTI assessment of binding affinities of TIM for CRY variant in dark (D) and in light (L). W394FΔ represents W394F mutant of CRYΔ (residue 1–520). AA represents the H377A/H378A CRY variant. Data is representative of 3 individual replicates, except that H378F has 2 replicates. (B) Quantification of 3A. Light-enhancement defined as in Figure 2E. A two-tailed single sample t-Test was performed with a hypothetical mean of 1. *p value ≤ 0.05. **p value ≤ 0.01.
(C) KD values reflect the relative binding strength between CRY variants and TIM with tighter interactions giving a smaller KD values. Dashed columns indicate values calculated based on the KD of corresponding dark samples and the light enhancements shown Figures 2F and 3B. All solid columns were compared to WT-D by one-way ANOVA. * Tukey HSD p value ≤0.05, ** Tukey HSD p value ≤ 0.01.

