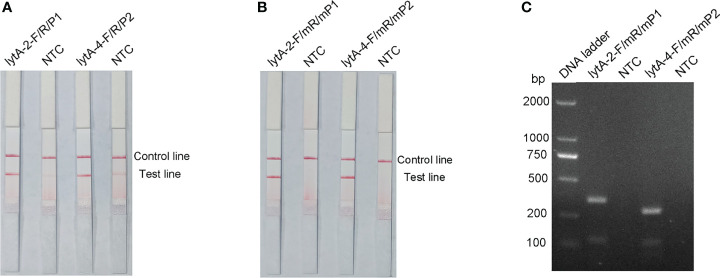
Figure 3.
Performance of the primer-probe sets tested with the RPA-LFS system. (A) Showing the LFS assay results of RPA amplification products before mismatch. (B) Showing the LFS assay results of RPA amplification products after mismatch. (C) Agarose gel results. The name of each primer-probe set is shown above the corresponding strip. NTC strip is the no-template control for the corresponding RPA. The positions of the test and control lines are marked on the right side of the bars. Reactions were performed at 37°C for 30 min. This image represents the results of three independent experiments.

