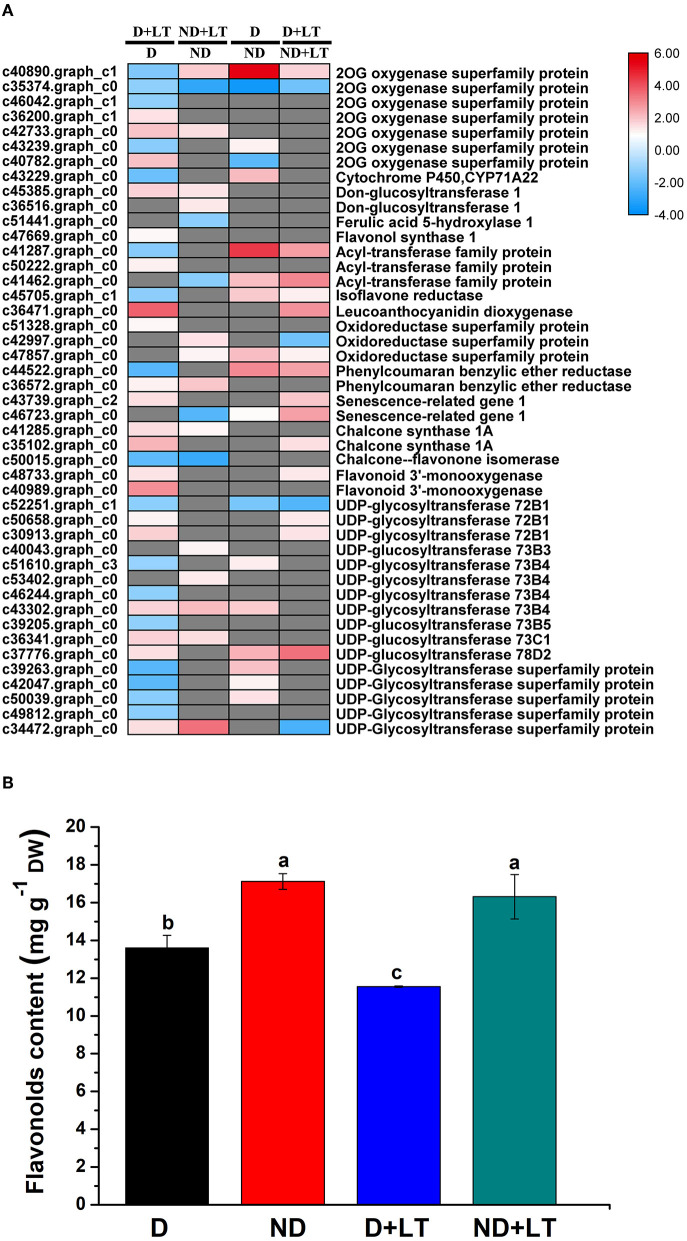
Figure 3.
Transcript profiles of flavonoids biosynthesis genes (A) and flavonoids content determination (B) in different dormancy varieties of alfalfa under LT. (A) The color scale indicates log2-transformed fold changes in expression levels between dormancy (D) and non-dormancy (ND) genotype under normal growth condition or LT condition. Red, blue, and gray denote upregulation, downregulation, and no change in expression, respectively. (B) Flavonoids contents of dormancy (D) and non-dormancy (ND) alfalfa varieties under LT condition. Columns marked with different letters indicate significant differences among treatments based on the LSD value (p ≤ 0.05; n = 3).

