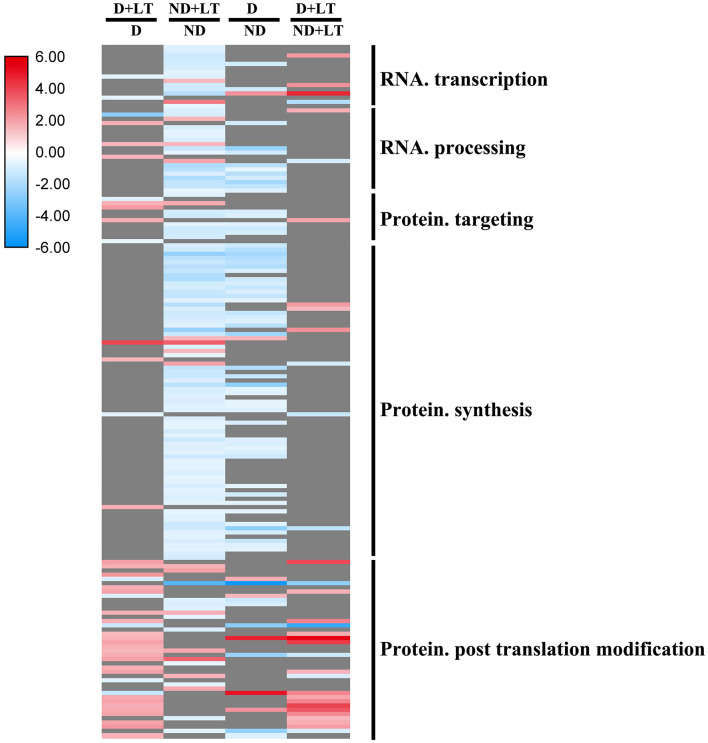
Figure 5.
Transcript profiles of RNA and protein synthesis genes in different dominancy varieties of alfalfa under LT. The color scale indicates log2-transformed fold changes in expression levels between dormancy (D) and non-dormancy (ND) genotype under normal growth conditions or LT conditions. Red, blue, and gray denote upregulation, downregulation, and no change in expression, respectively.

