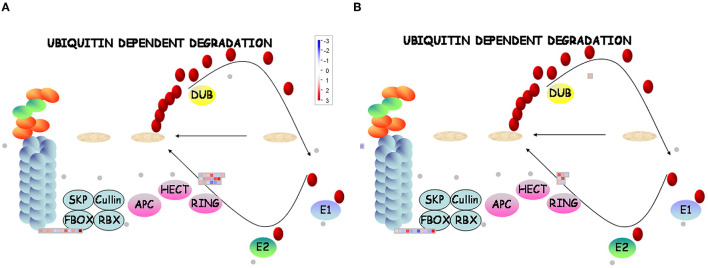
Figure 6.
MapMan display of the coordinated changes in the expression levels of genes involved in the ubiquitin-dependent degradation pathway in different dormancy varieties of alfalfa under LT. Shown are DEGs in (D + LT)/D (A) and (ND + LT)/ND (B) under LT condition. Squares represent DEGs, red and blue indicate up- and downregulated genes, respectively. dormancy (D), non-dormancy (ND).

