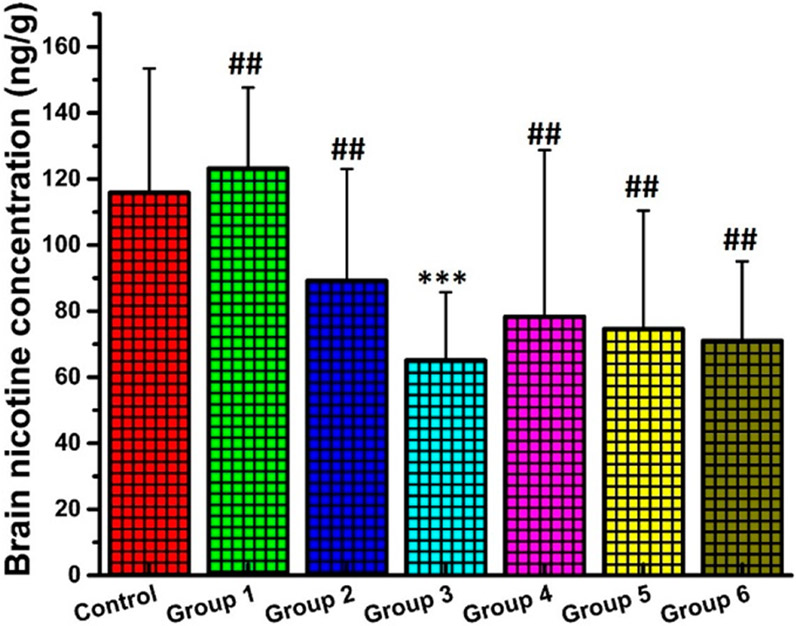
Figure 6.
Brain nicotine concentrations. All mice that were treated with either nicotine vaccines or PBS buffer were subcutaneously administered with 0.07 mg/kg nicotine on day 120, and the brain nicotine concentrations were measured. *** denotes that the brain nicotine concentration in group 3 was significantly lower than that of the control (P-value is less than 0.05). ## denotes that the brain nicotine concentrations in groups 1, 2, 4, 5, and 6 were not significantly different from that of the control.

