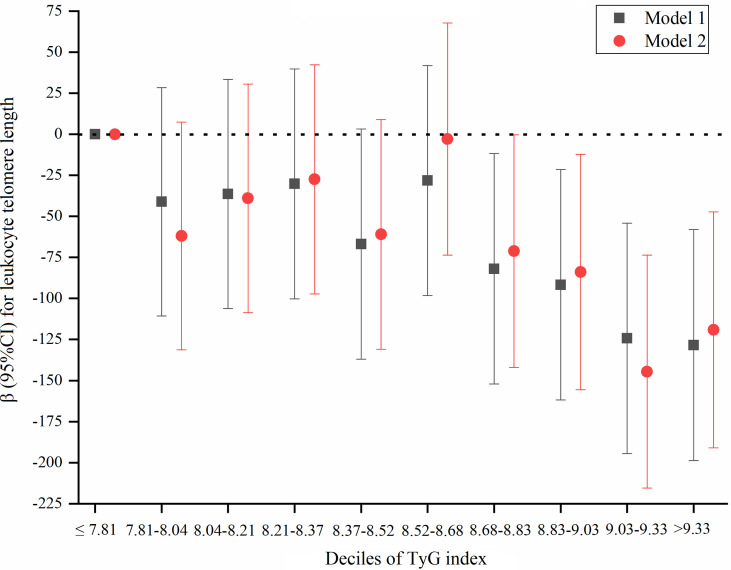
Figure 3.
A dose-response association between TyG index by a decile approach and LTL. Model 1 was adjusted for age; model 2 was adjusted for age, sex, education, smoking status, alcohol consumption, physical activity, BMI, waist circumference, SBP, DBP, history of hypertension, TC, SUA, eGFR, and CR"P".

