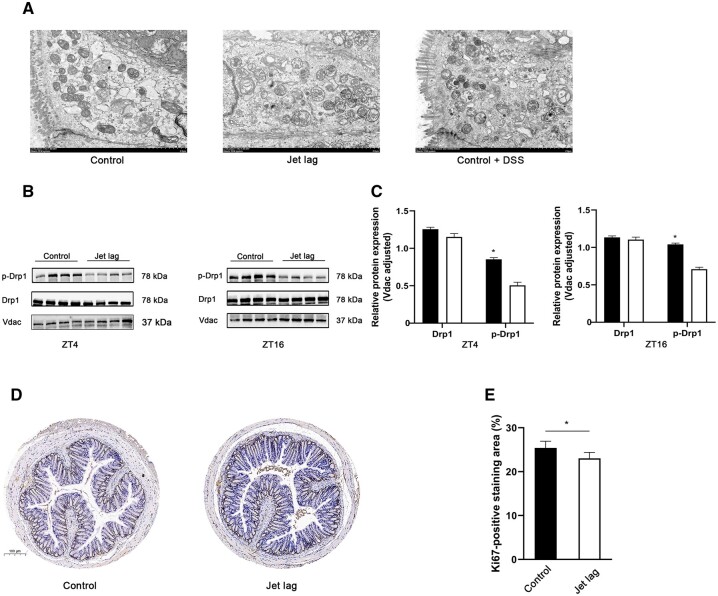
Figure 2.
Mitochondrial alterations after jet lag. (A) Representative mitochondrial morphological changes were detected using transmission electron microscopy (six mice per group). (B) Western blot analysis of Drp1 and p-Drp1 at ZT4 and ZT16 (six mice per group). (C) The relative expression of Drp1 and p-Drp1 normalized with Vdac (six mice per group). (D) Photomicrograph of mice colon tissue immunohistochemical analysis for Ki67. (E) Qualification of Ki67-positive staining area (six mice per group). The values are expressed as mean ± SD. *P < 0.05 vs control mice at individual time points (t-test). ZT, zeitgeber time; DDS, dextran sodium sulfate.

