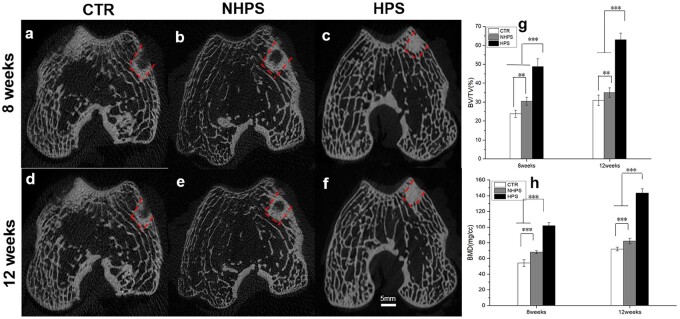
Figure 7.
Micro-CT analysis of bone regeneration in defects at 8 and 12 weeks. (a and d) Micro-CT images for the CTR group. (b and e) Micro-CT images for the NHPS group. (c and f) Micro-CT images for the HPS group. (g) Micro-CT analysis of bone volume fraction (BV/TV). (h) Micro-CT analysis of bone mineral density (BMD).

