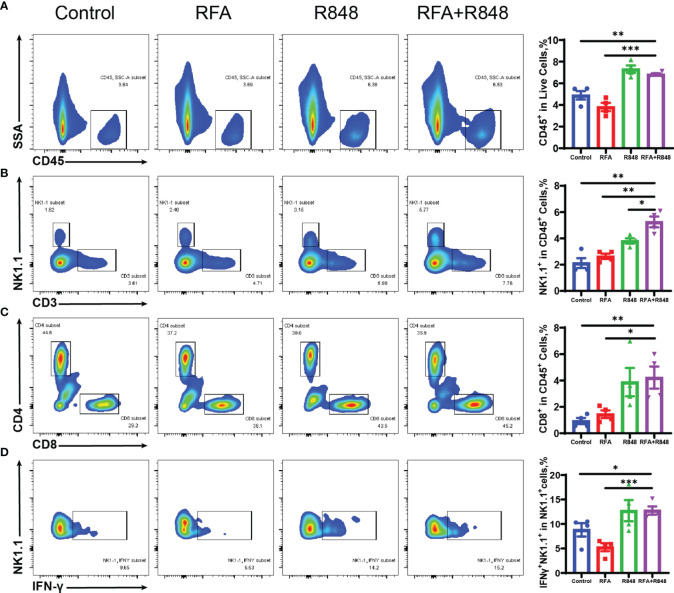
Figure 2.
The composition of tumor-infiltrating immune cells is changed after combination therapy. (A) Ratio of tumor-infiltrating immune (CD45+) cells to live cells in different groups; quantitative analysis results are shown on the right. (B) Representative flow cytometry plots of the percent of tumor-infiltrating NK (CD3-NK1.1+) cells in CD45+ cells and the corresponding quantitative results. (C) Intra-tumoral CD8+ T cells were gated from CD3+ cells, and then the ratio of CD8+ to CD45+ was calculated; %CD8+ T in CD45+ cells = %(CD8+CD3+CD45+/CD45+). (D) The proportion of IFNγ-secreting NK (IFNγ+NK1.1+) cells to total NK cells in the tumors of mice that received different treatments. The experimental results from one of the two independent experiments are shown; n = 4 per group. Statistical comparison was performed by two-tailed Student’s t-test. All error bars represent mean ± SEM. *p < 0.05; **p < 0.01; ***p < 0.001. IFNγ, interferon γ; NK, natural killer.

