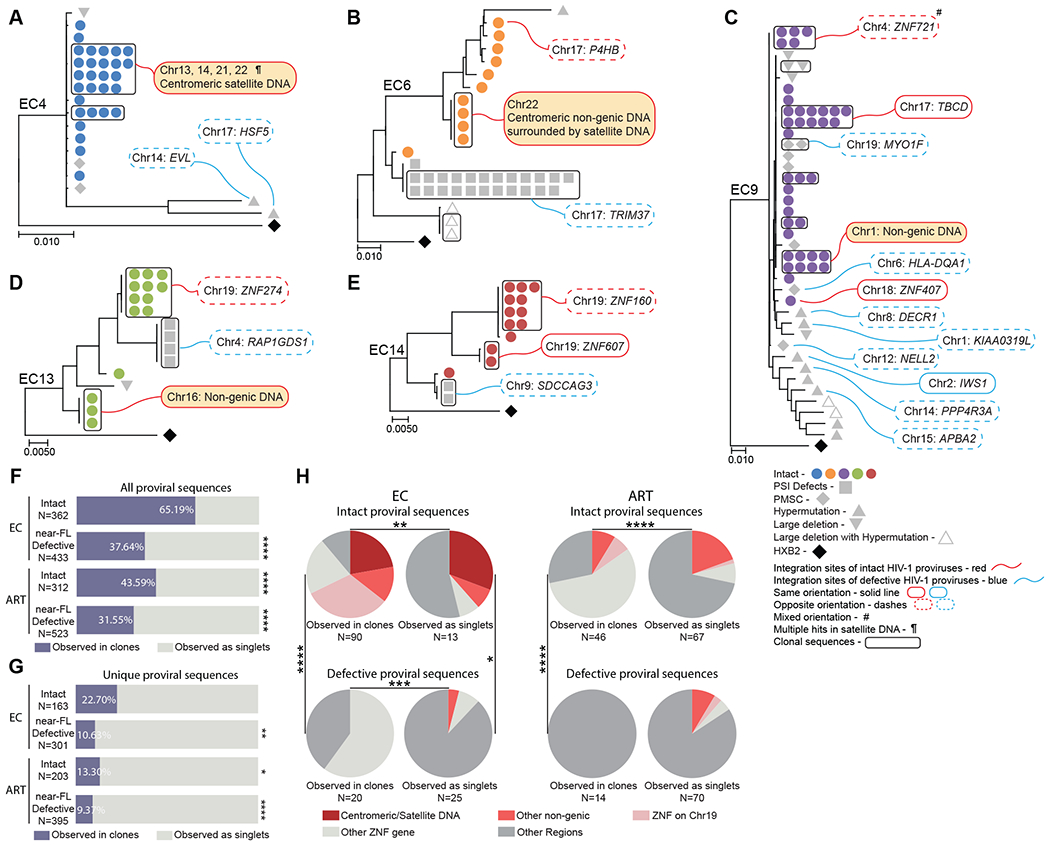
Fig. 1. Chromosomal positioning of defective proviruses from ECs.

(A to E) Maximum-likelihood phylogenetic trees of near full-length proviral sequences from 5 representative elite controllers are shown. Symbol shapes indicate proviral sequence classification. Genes harboring proviral integrations were identified using Ensembl (v86); gene names are shown according to the HUGO classification (https://www.genenames.org). PSI defects: packaging-signal defects; PMSC: premature stop codons; # Integration sites with mixed orientation among multiple genes; ¶ multi-hit integration sites that cannot be definitively mapped to one genomic location due to positioning in repetitive centromeric satellite DNA present in multiple regions of the human genome. Clonally-expanded proviruses, defined by identical proviral sequences and identical corresponding integration sites, are highlighted in curved black boxes. (F and G) Proportions of intact and defective proviruses observed in clones (in purple) or as singlets (in gray) from ECs and ART-treated individuals are shown. Clonal sequences are counted individually (F) or only once (G). Statistical comparisons were made relative to intact proviruses from ECs. Near-FL: near full-length. (H) Pie charts are shown reflecting proportions of integration sites of intact and defective proviruses in defined genomic regions. Data are shown for clonal sequences (counted individually) and for sequences detected as singlets from ECs and ART-treated individuals. FDR-adjusted two-sided Fisher’s exact tests were used in (F) and (G). A chi-square test was used in (H). * P < 0.05, ** P < 0.01, *** P < 0.001, ****P < 0.0001.
