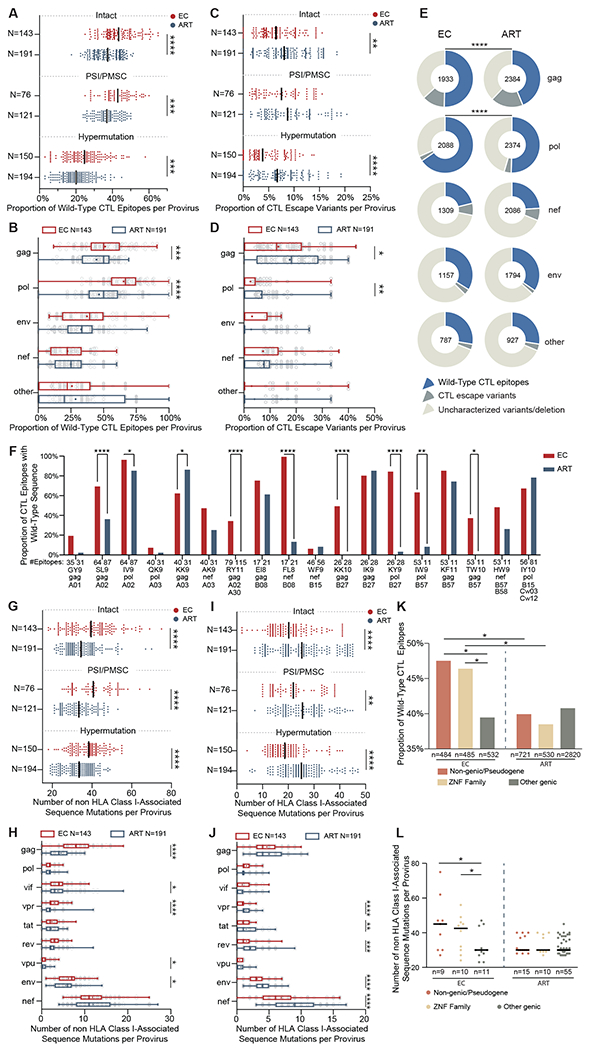
Fig. 3. Footprints of CTL-mediated immune pressure in intact and defective proviruses from ECs and ART-treated individuals.

(A to D) Proportions of optimal CTL epitopes (restricted by autologous HLA class I alleles) with wild-type clade B consensus sequences (A and B) or with previously-described CTL escape mutations (C and D) are shown. Each dot represents one provirus. Intact and near full-length proviral sequences with PSI defects/PMSC or hypermutation from ECs and ART treated individuals are shown in (A) and (C). CTL epitope sequences (restricted by autologous HLA class I alleles) within gag, pol, env, nef and other HIV-1 proteins from clade B intact proviruses in ECs and ART-treated individuals are shown in (B) and (D). (E) Pie charts are shown reflecting proportions of CTL epitopes displaying the clade B consensus sequences, previously-described CTL escape variants or uncharacterized sequence variations. Data are shown separately for indicated HIV-1 products; the number within each pie chart indicates the total number of analyzed CTL epitopes restricted by autologous HLA class I alleles in each viral protein for each study cohort. (F) Proportions of epitopes with wild-type clade B consensus sequences are shown among CTL epitopes restricted by common autologous HLA class I alleles within ECs and ART-treated individuals. (G to J) Numbers of sequence variations with (I and J) or without (G and H) statistically significant associations with autologous HLA class I alleles are shown, determined as described by (31). Each dot represents one provirus. Intact proviruses and near full-length proviral sequences with PSI defects/PMSC, or hypermutation from ECs and ART treated individuals are shown in (G) and (I); sequences of nine individual HIV-1 genes from intact proviruses in ECs and ART-treated individuals are shown in (H) and (J). (K and L) Proportions of optimal CTL epitopes with wild-type clade B consensus sequences (K) and numbers of mutations non-adapted to autologous HLA class I alleles (L) are shown from HIV proviruses integrated in indicated genomic regions in ECs and ART-treated individuals. Clonal sequences were counted once. Dot plots with median are shown. Box-and-whisker plots reflect mean, median, minimum, maximum, and interquartile ranges. FDR-adjusted two-tailed Mann Whitney U tests were used in (A to D) and (G to J). Two-sided Fisher’s exact tests were used in (E and F). FDR-adjusted two-sided Kruskal-Wallis nonparametric test was used in panels (K and L). * P < 0.05, ** P < 0.01, *** P < 0.001, ****P < 0.0001.
