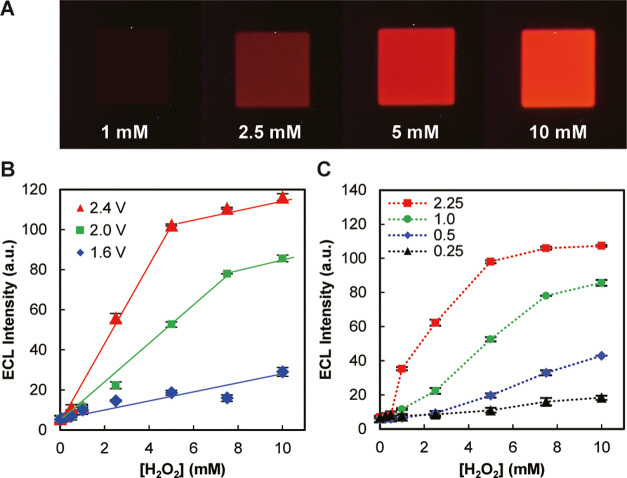
Figure 3.
Device response to H2O2. (A) ECL images obtained with 1, 2.5, 5, and 10 mM H2O2. Driving voltage: 2.4 V. (B) Dependence of ECL intensity on H2O2 concentration obtained at different driving voltages (1.6, 2.0, and 2.4 V). (C) Dependence of ECL intensity on H2O2 concentration obtained with different area ratios of cathodic and anodic poles (Ac/Aa = 0.25, 0.5, 1, and 2.25). Driving voltage: 2.0 V. The symbols and error bars in B (n = 9) and C (n = 3) indicate, respectively, the means and standard deviations of ECL intensities, which were measured experimentally from separate anodic poles in the same device under the designated conditions.

