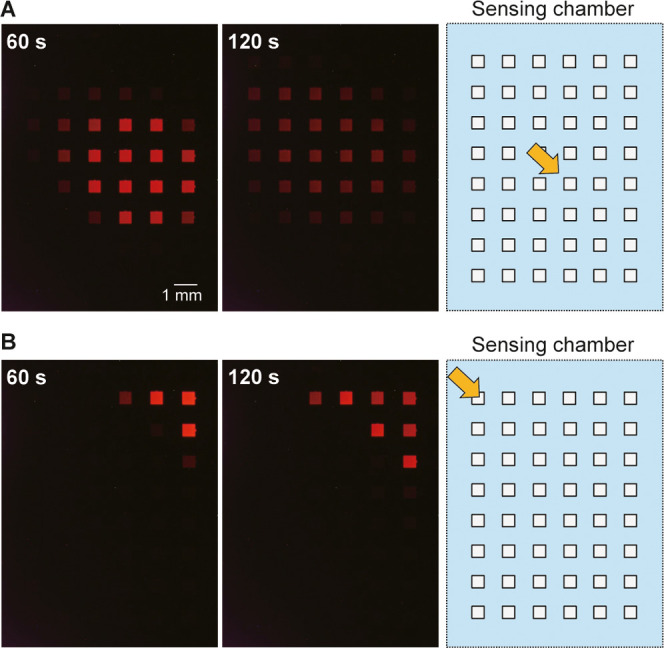
Figure 4.

Change in ECL intensity on the array of anodic poles when a H2O2 solution (100 mM, 20 μL) was dropped onto 1 mL of 50 mM PBS (pH 7.4) containing 100 mM KNO3 at (A) the center or (B) the upper left part of the array of cathodic poles. The type I device contained an array of 6 × 8 cathodes and anodes. Left: ECL images taken at 60 and 120 s after dropping the solution. The rightmost figure is the layout of the array of cathodic poles, with the orange arrow indicating the location of the dropped H2O2 solution. Applied voltage: 2.4 V.
