Figure 8.
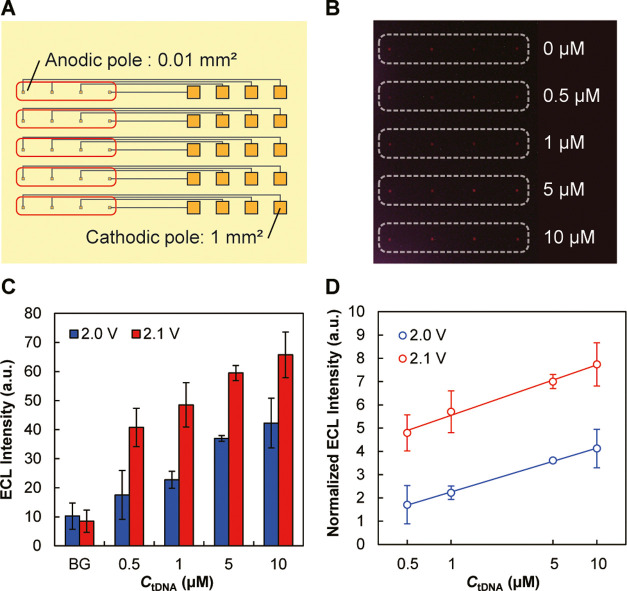
DNA sensing using a BPE array. (A) BPE array used for this purpose, with the area ratio of the cathodic to the anodic pole (Ac/Aa) of 100. Areas surrounded by the red lines correspond to the white dotted line in panel B. (B) ECL images obtained after incubating the BPEs with 0, 0.5, 1, 5, and 10 μM tDNA solutions and 100 μM MB solution in each flow channel. Driving voltage: 2.1 V. A magnified image of panel B is provided as Figure S6 in the Supporting information. (C) Dependence of ECL intensity on the concentration of tDNA obtained at driving voltages of 2.0 and 2.1 V. “BG” indicates the background intensity obtained from areas without ECL emission. (D) Dependence of ECL intensity normalized by the background intensity on tDNA concentration. Panels (C) and (D) display the average values and standard deviations of ECL intensities obtained from the four anodic poles at the same CtDNA (n = 4).

