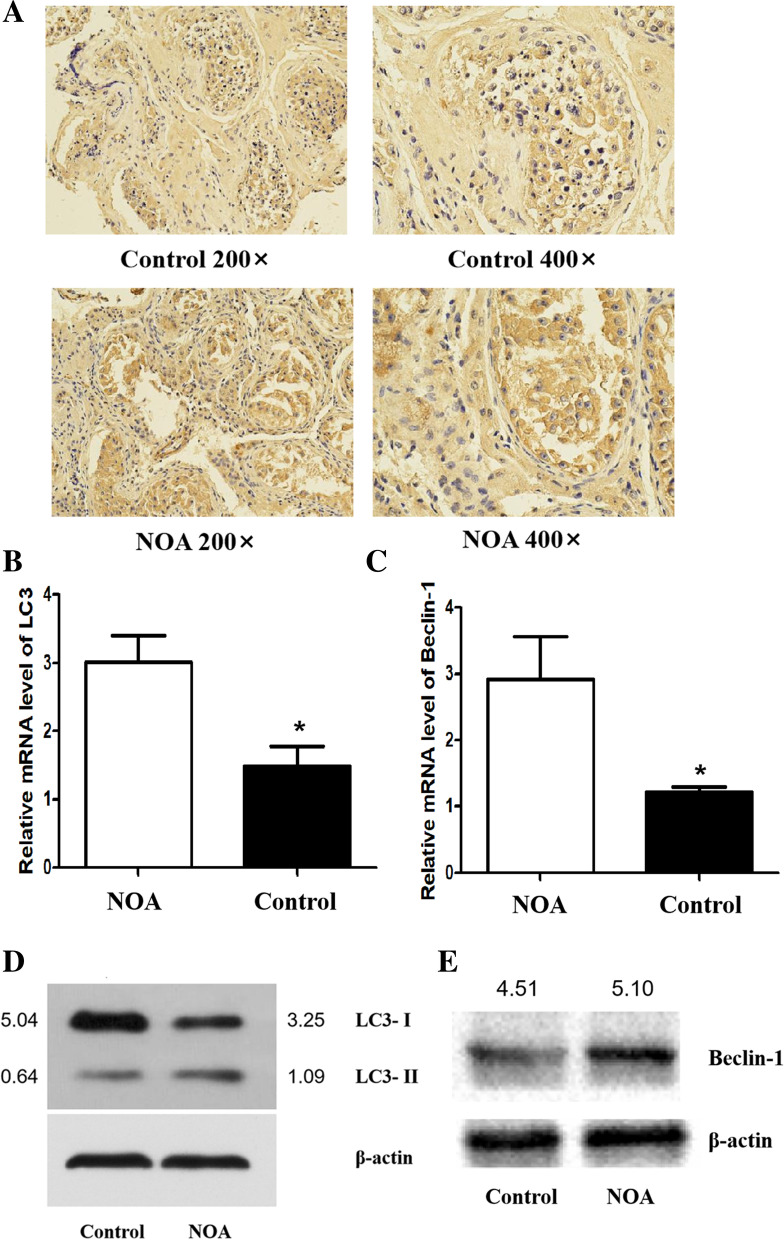
Fig. 3.
The expression of LC3 and Beclin-1 and the localization of LC3 in testicular tissue. The LC3 protein was localized mainly in the cytoplasm of spermatogenic cells at all levels, showing a brownish yellow colour. The LC3 protein level in NOA patients was elevated in comparison with the LC3 protein level in the control group. B-C LC3 (B) and Beclin-1 (C) gene expression levels in the NOA group were enhanced. D-E LC3 (D) and Beclin-1 (E) protein expression levels in the NOA group were higher than the levels in the control group. *Statistically significant difference compared with the control group (P < 0.05)

