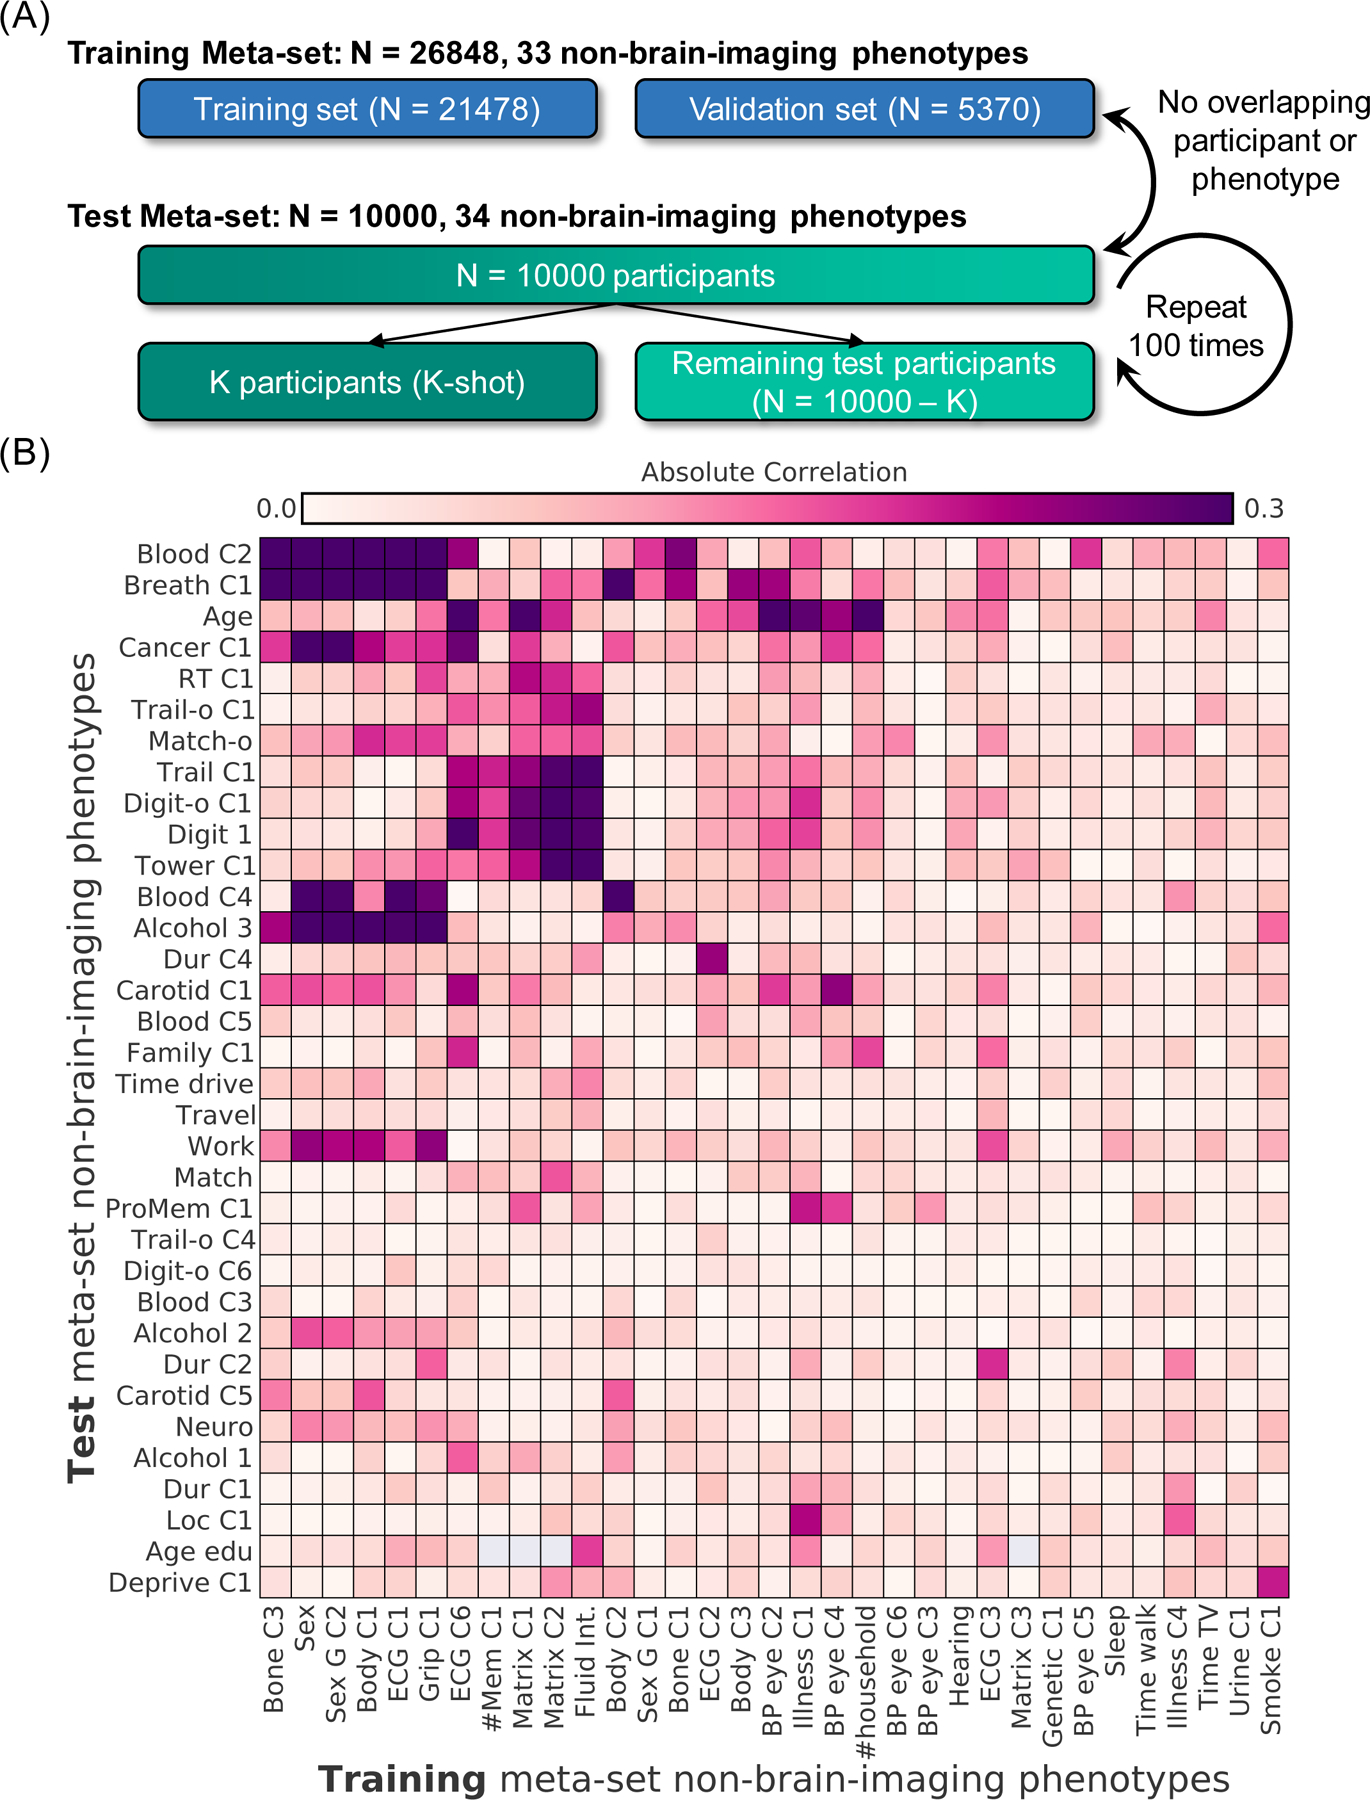
Figure 1. Experimental setup for meta-matching in the UK Biobank.

The goal of meta-matching is to translate predictive models from big datasets to new unseen phenotypes in independent small datasets. (A) The UK Biobank dataset (Jan 2020 release) was divided into a training meta-set comprising 26,848 participants and 33 phenotypes, and a test meta-set comprising independent 10,000 participants and 34 other phenotypes. It is important to emphasize that no participant or phenotype overlapped between training and test meta-sets. The test meta-set was in turn split into K participants (K = 10, 20, 50, 100, 200) and remaining 10,000-K participants. The group of K participants mimicked studies with traditionally common sample sizes. This split was repeated 100 times for robustness. (B) Absolute Pearson’s correlations between phenotypes in training and test metasets. Each row represents one test meta-set phenotype. Each column represents one training meta-set phenotype. Figures S2 and S3 show correlation plots for phenotypes within training and test meta-sets. Dictionary of phenotypes is found in Tables S1 and S2.
