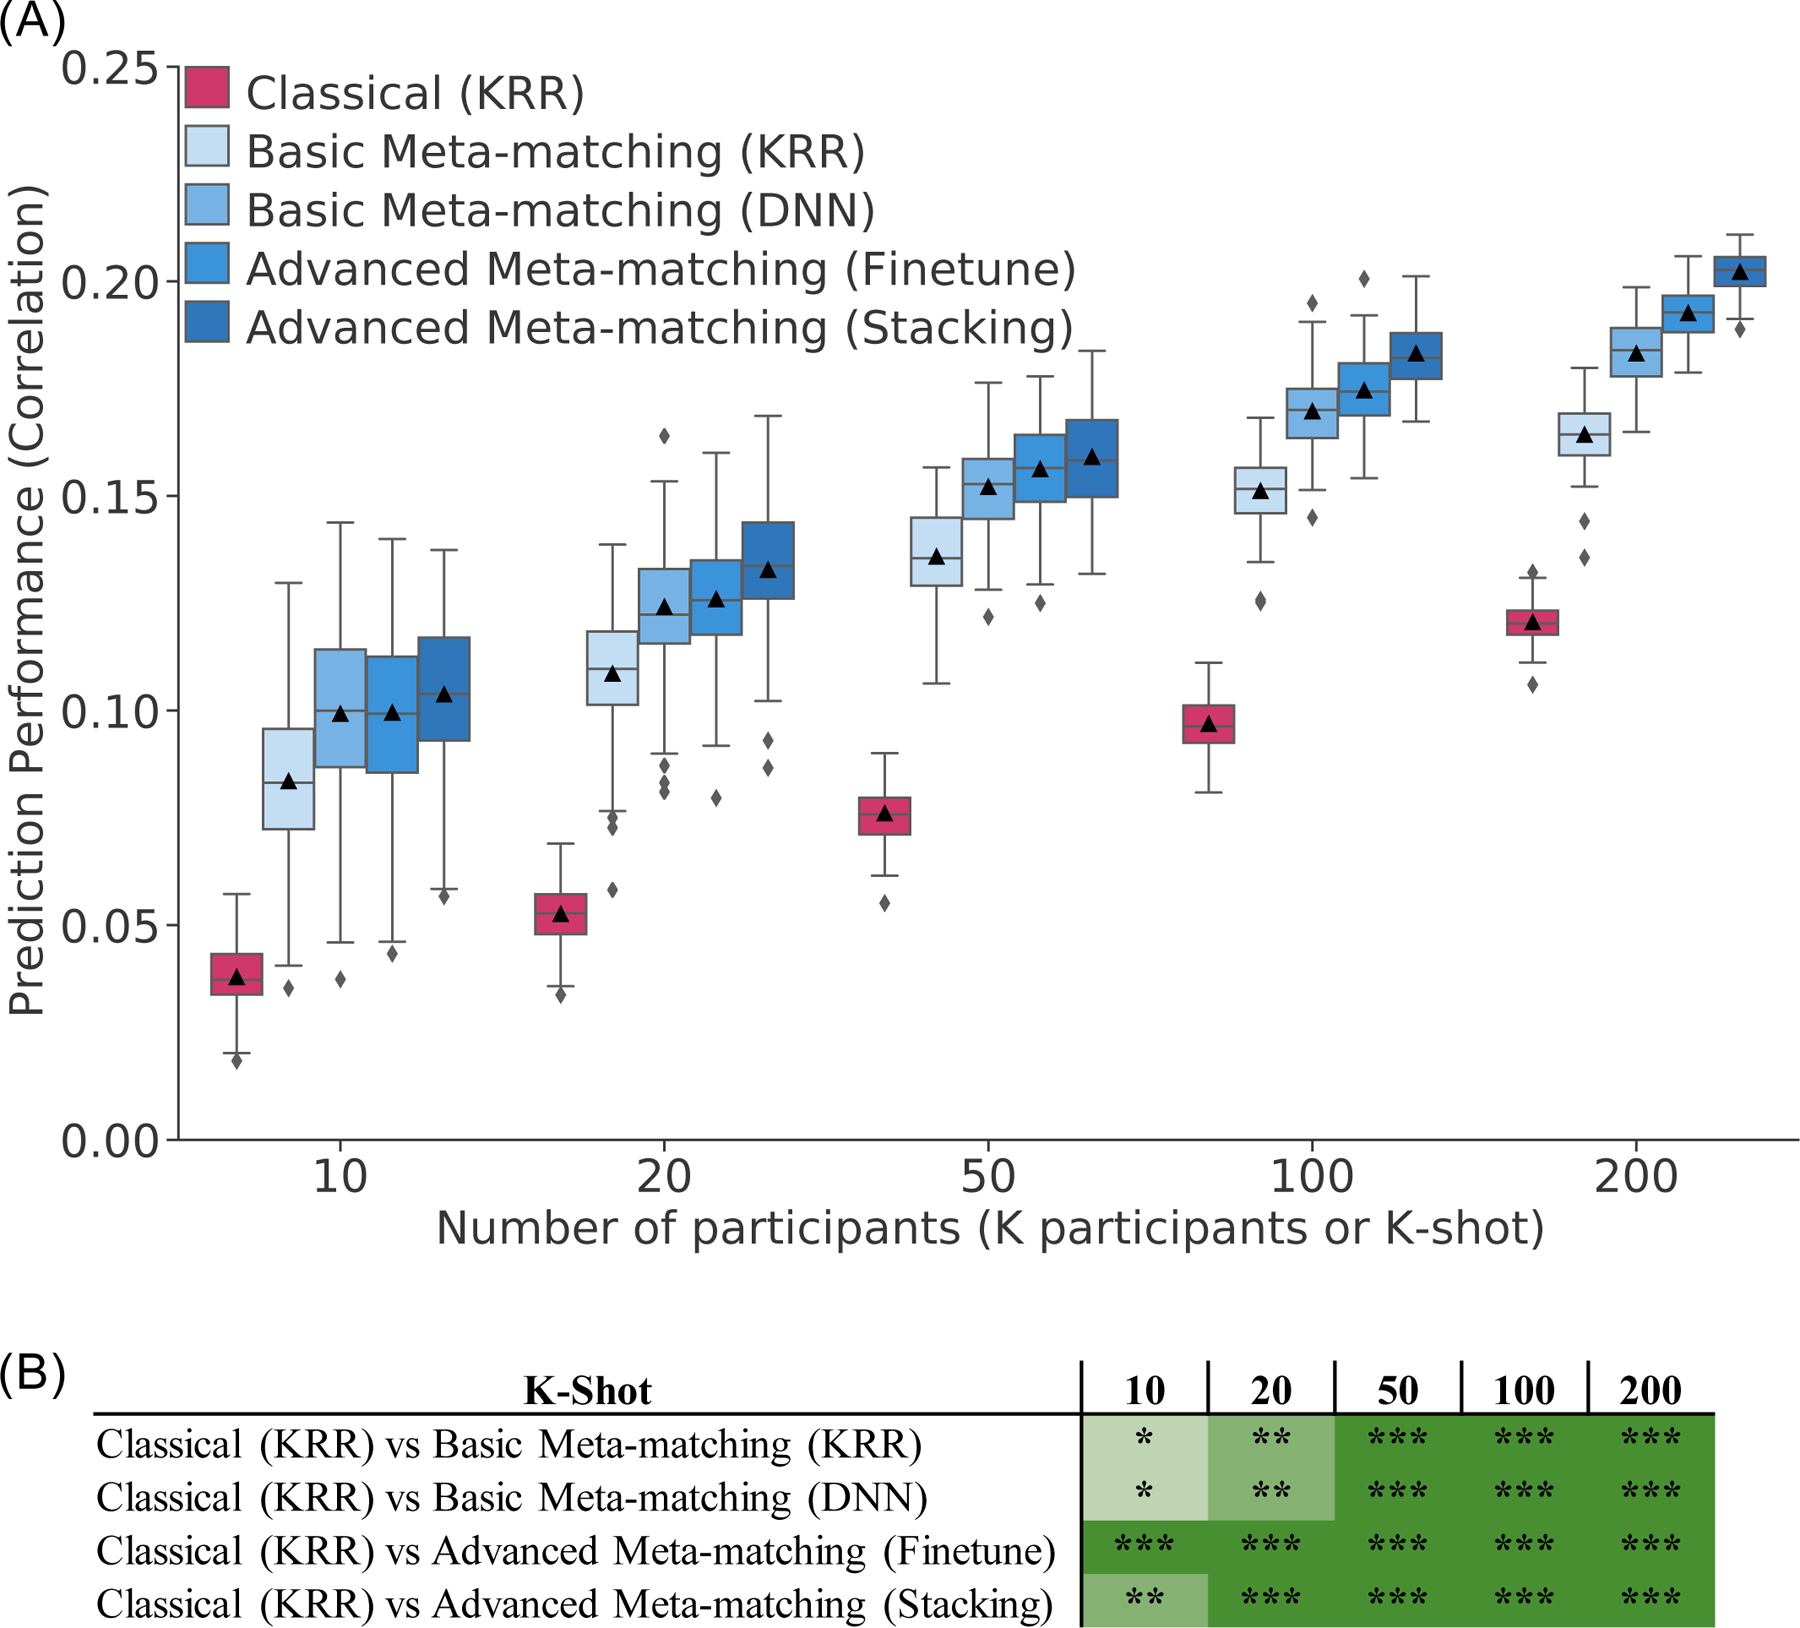
Figure 3. Meta-matching reliably outperforms predictions from classical kernel ridge regression (KRR) in the UK Biobank.

(A) Prediction performance (Pearson’s correlation) averaged across 34 phenotypes in the test meta-set (N = 10,000 – K). The K participants were used to train and tune the models (Figure 2). Boxplots represent variability across 100 random repeats of K participants (Figure 1A). Whiskers represent 1.5 inter-quartile range. (B) Statistical difference between the prediction performance (Pearson’s correlation) of classical (KRR) baseline and meta-matching algorithms. P values were calculated based on a two-sided bootstrapping procedure (see Methods). “*” indicates p < 0.05 and statistical significance after multiple comparisons correction (FDR q < 0.05). “**” indicates p < 0.001 and statistical significance after multiple comparisons correction (FDR q < 0.05). “***” indicates p < 0.00001 and statistical significance after multiple comparisons correction (FDR q < 0.05). “n.s.” indicates no statistical significance (p ≥ 0.05) or did not survive FDR correction. Green color indicates that meta-matching methods were statistically better than classical (KRR). The actual p values and statistical comparisons among all algorithms are found in Figure S4. Prediction performance measured using coefficient of determination (COD) is found in Figure S5.
