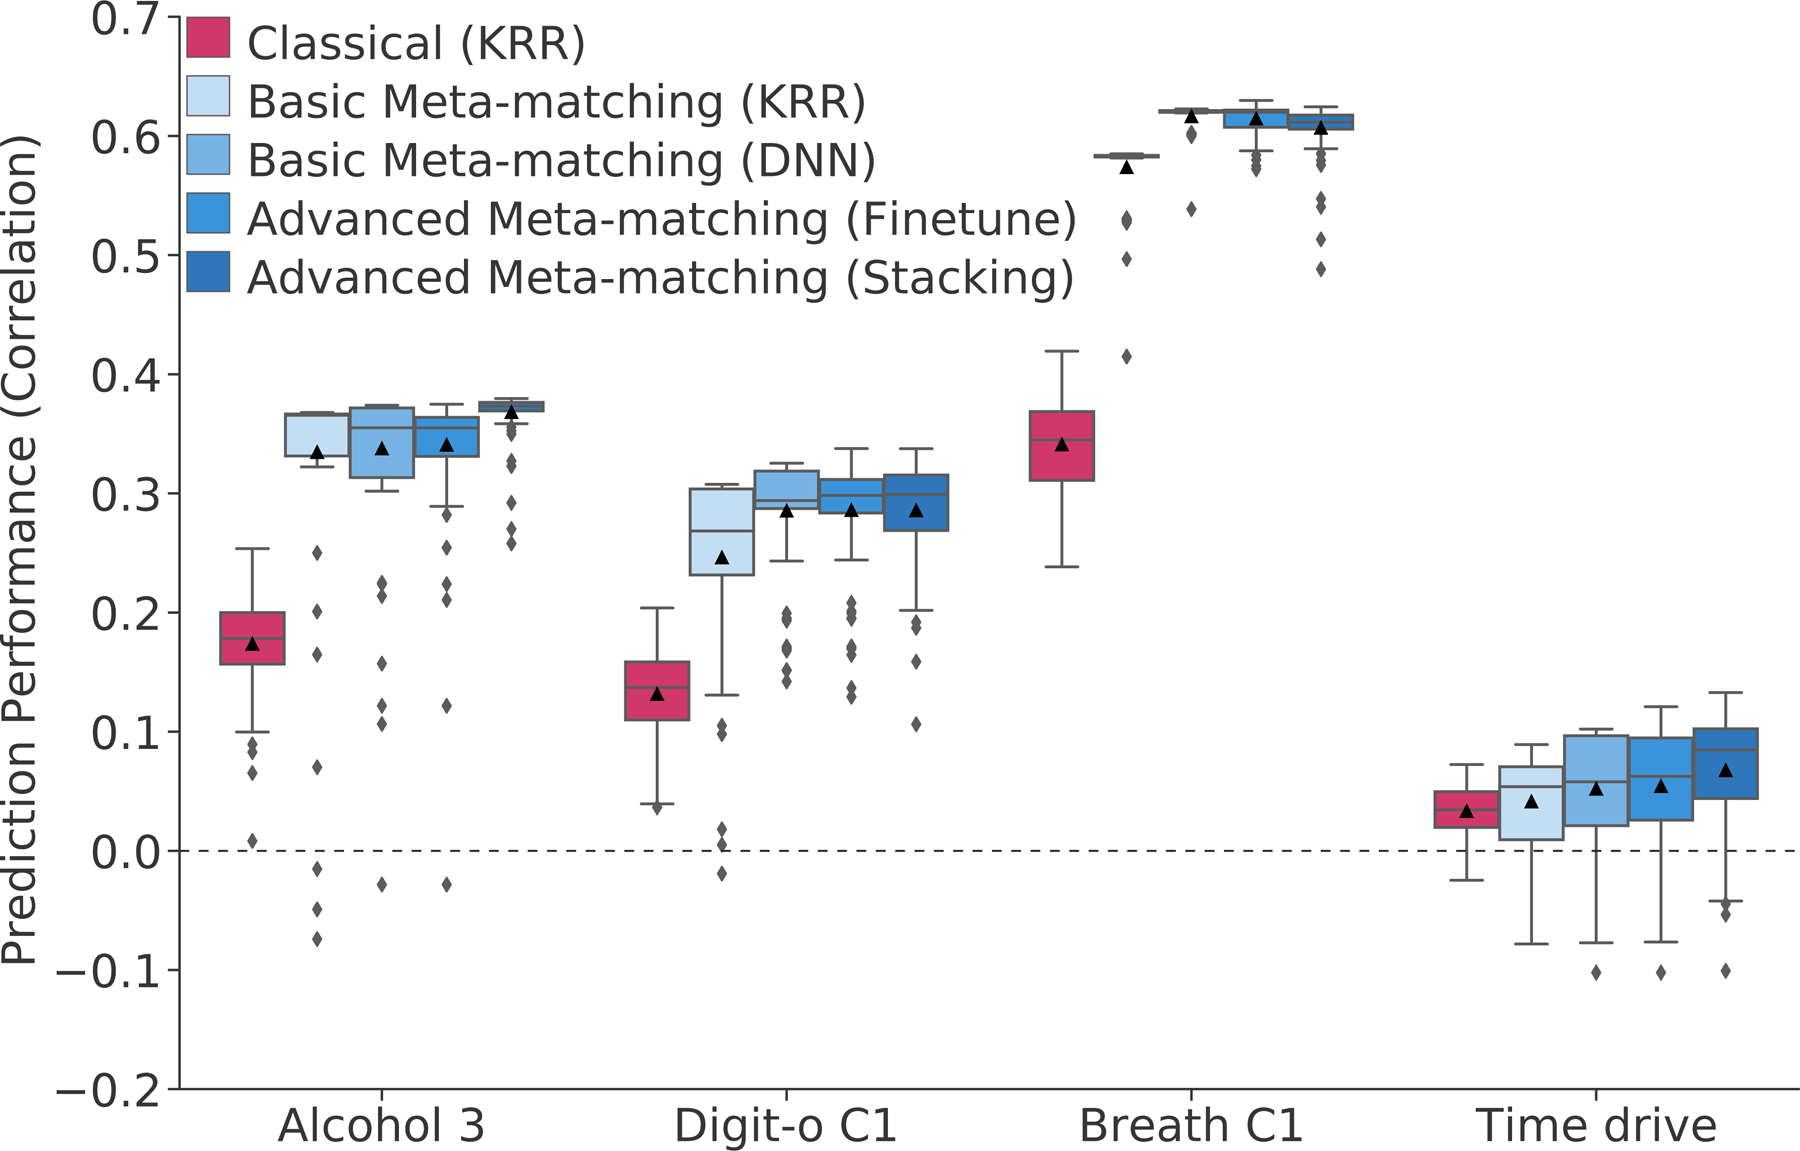
Figure 4. Examples of phenotypic prediction performance in the test meta-set (N = 9,900) in the case of 100-shot learning.

Here, prediction performance was measured using Pearson’s correlation. “Alcohol 3” (average weekly beer plus cider intake) was most frequently matched to “Bone C3” (bone-densitometry of heel principal component 3). “Digit-o C1” (symbol digit substitution online principal component 1) was most frequently matched to “Matrix C1” (matrix pattern completion principal component 1). “Breath C1” (spirometry principal component 1) was most frequently matched to “Grip C1” (hand grip strength principal component 1). “Time drive” (Time spent driving per day) was most frequently matched to “BP eye C3” (blood pressure & eye measures principal component 3). For each boxplot, the horizontal line indicates the median and the black triangle indicates the mean. The bottom and top edges of the box indicate the 25th and 75th percentiles respectively. Whiskers correspond to 1.5 times the interquartile range. Outliers are defined as data points beyond 1.5 times the interquartile range. Figure S7 shows an equivalent figure using coefficient of determination (COD) as the prediction performance measure.
