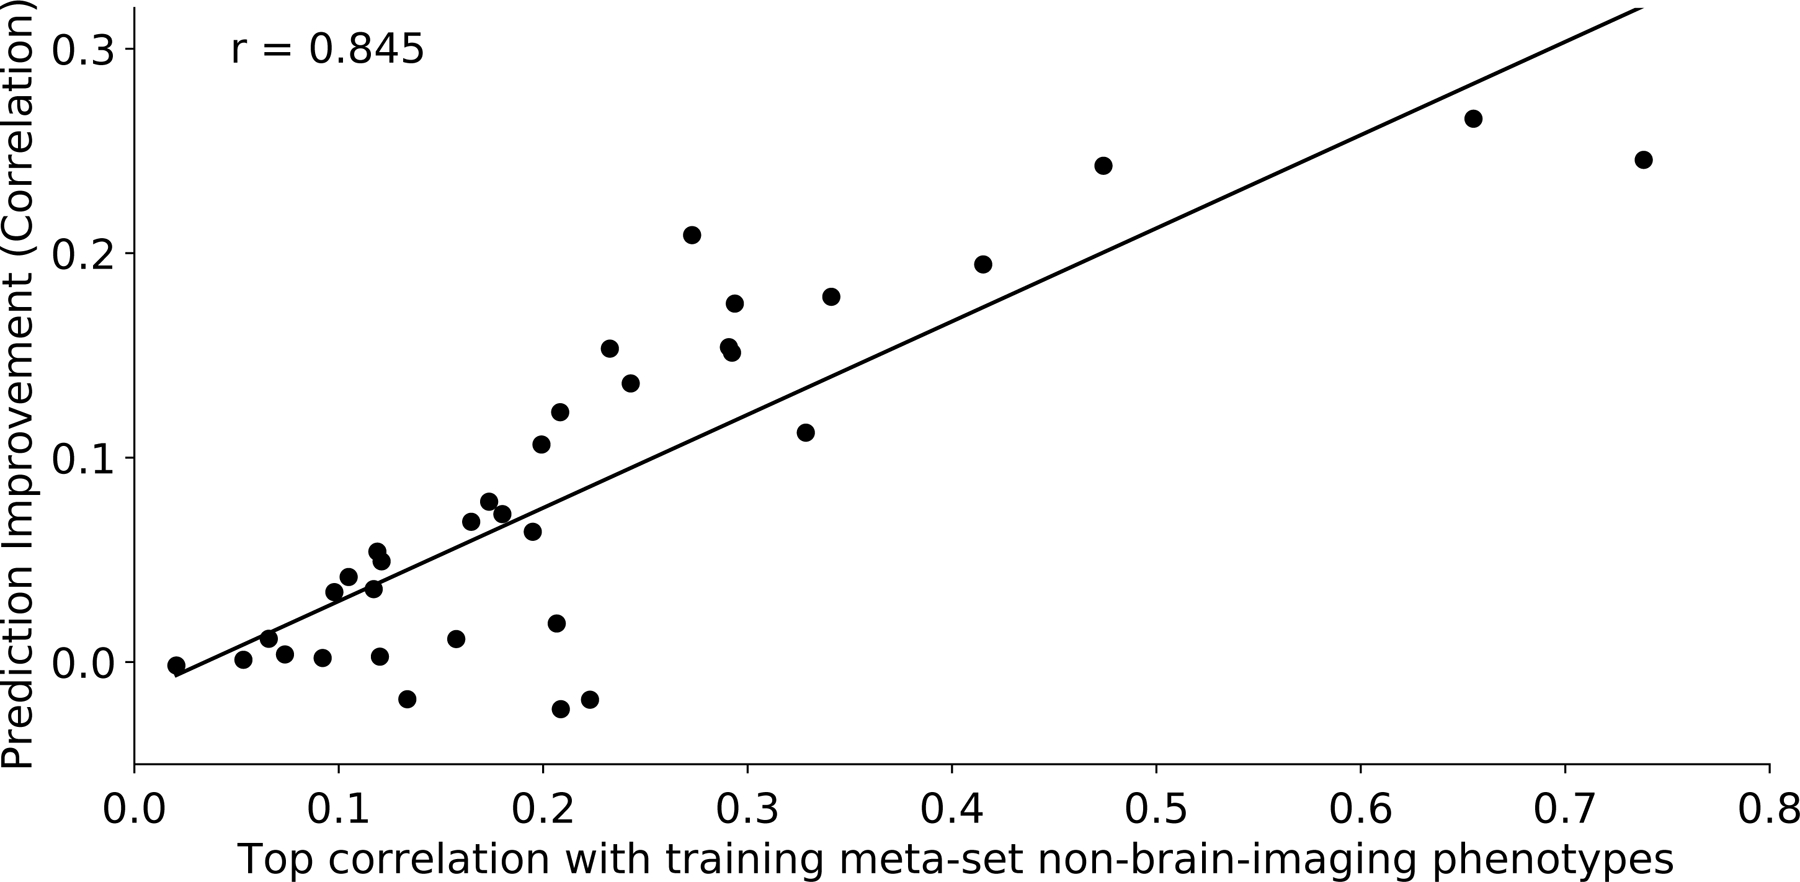
Figure 5. Prediction improvements were driven by correlations between training and test meta-set phenotypes.

Vertical axis shows the prediction improvement of advanced meta-matching (stacking) with respect to classical (KRR) baseline under the 100-shot scenario. Prediction performance was measured using Pearson’s correlation. Each dot represents a test meta-set phenotype. Horizontal axis shows each test phenotype’s top absolute Pearson’s correlation with phenotypes in the training meta-set. Test phenotypes with stronger correlations with at least one training phenotype led to greater prediction improvement with meta-matching. Similar conclusions were obtained with coefficient of determination (Figure S8).
