Figure 14.

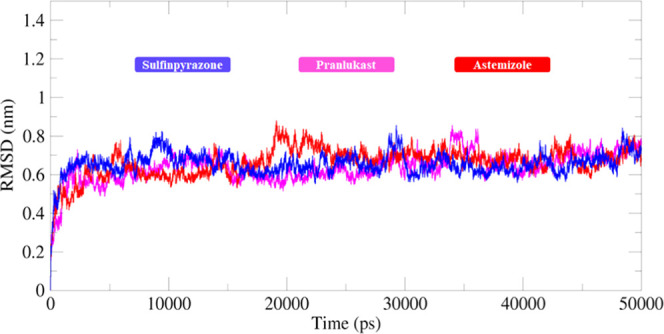
RMSD graph of sulfinpyrazone–EWS (blue), chlorthalidone–EWS (pink), and astemizole–EWS (red) docked structures. In the generated graph, the Y-axis showed RMSD values, whereas the X-axis represents simulation time from 0 to 50 000 ps.

RMSD graph of sulfinpyrazone–EWS (blue), chlorthalidone–EWS (pink), and astemizole–EWS (red) docked structures. In the generated graph, the Y-axis showed RMSD values, whereas the X-axis represents simulation time from 0 to 50 000 ps.