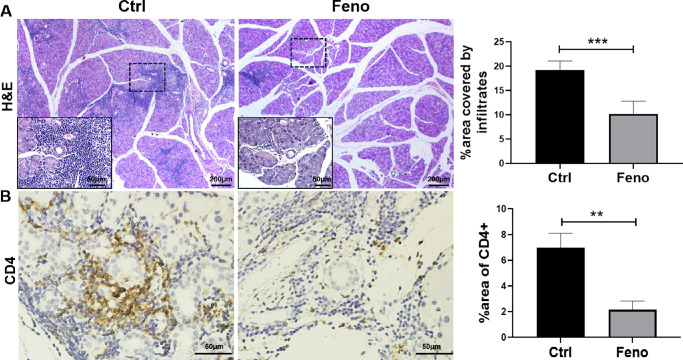
Figure 2.
Fenofibrate treatment suppressed inflammatory cell infiltration in LGs. (A) Male NOD mice were treated with and without fenofibrate-supplemented diet for 8 weeks starting at 15 weeks of age. Lacrimal gland sections from treated mice were stained with H&E, and representative sections are shown. Higher magnifications are displayed in the lower left of each H&E-stained image. Lower magnification bars are 200 µm, while higher magnification bars are 50 µm. (B) Immunohistochemical staining of CD4 displayed CD4+ T cells. Scale bar: 50 µm. Inflammatory cell infiltration was quantified as described in the Materials and Methods section. Image analysis of the LG shows the percentage of inflammatory cell infiltration area relative to the entire LG section. Data are representative of three independent experiments. Data are presented as mean ± SD (n = 3–7, Student's t-test, **P < 0.01, ***P < 0.001).

