
FIGURE 3.
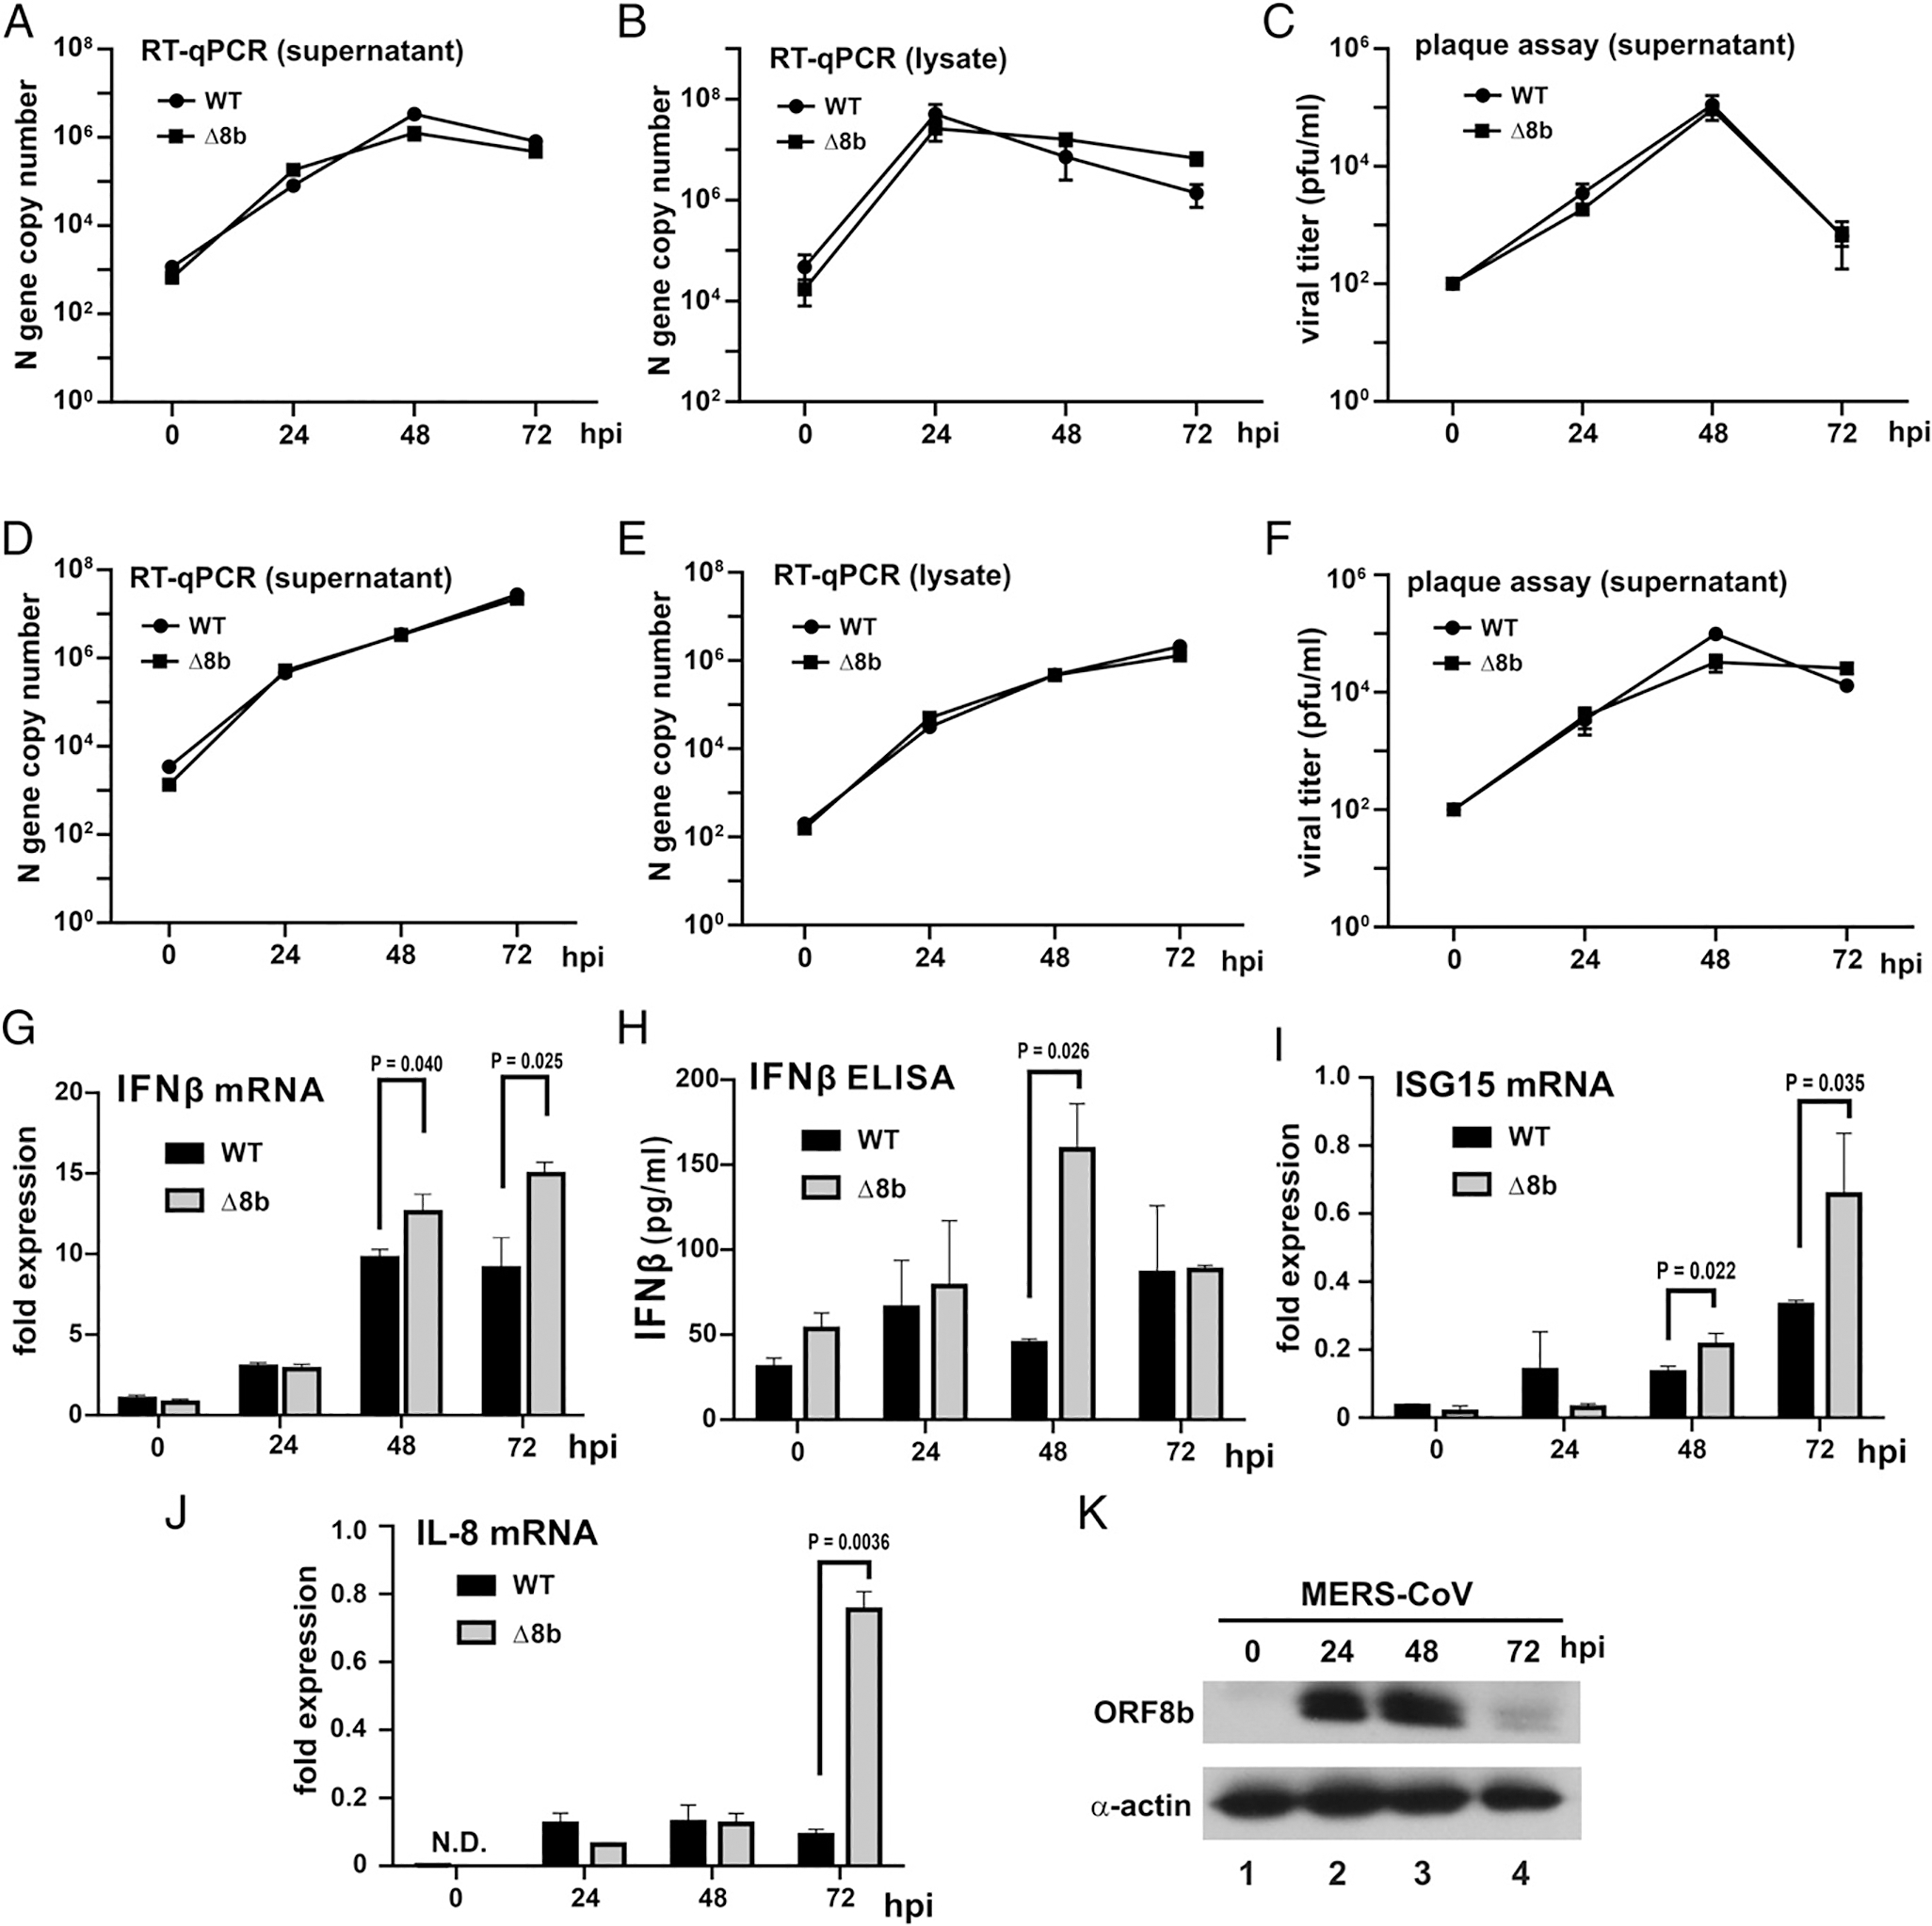
Replication kinetics and IFN-β induction of WT and Δ8b viruses. Huh-7 (A–C) and Vero E6 (D–F) cells were infected by WT and Δ8b viruses at an MOI of 0.01 for the indicated time points. Supernatants (A and D) and cell lysates (B and E) were harvested, and viral titers were quantified by N gene quantification with reference to a standard curve of WT MERS-CoV with the titer previously determined by standard plaque assay. Viral plaque assay from supernatant of Huh-7 (C) and Vero E6 (F) were performed to determine the amount of infectious virus present at the indicated time point. Each data point represents the mean (n = 3), and error bars indicate their SD. (G–K) Enhanced IFN-β induction by Δ8b viruses. Huh-7 cells were infected by WT and Δ8b viruses at an MOI of 0.01 for the indicated time points. Infected cells were harvested for total RNA, and the levels of IFN-β (G), ISG15 (I), and IL-8 (J) transcripts were determined by RT-qPCR. Supernatants of the same experiment were also collected for measuring the abundance of IFN-β secreted by ELISA (H). Fold expression of IFN-β transcripts was determined by ΔΔCT against GAPDH at time 0. Three independent experiments were performed. Bars represent the mean (n = 3), and error bars indicate their SD. The statistical significance between selected samples was evaluated by a two-tailed Student t test for unpaired samples with equal variance, and p values (P) were indicated. (K) Huh-7 cells were infected at an MOI of 0.01 for the indicated time points. Cells were harvested, and total cell lysates were resolved by SDS-PAGE followed by Western blotting. β-Actin was included as an internal loading control. N.D., not detected.