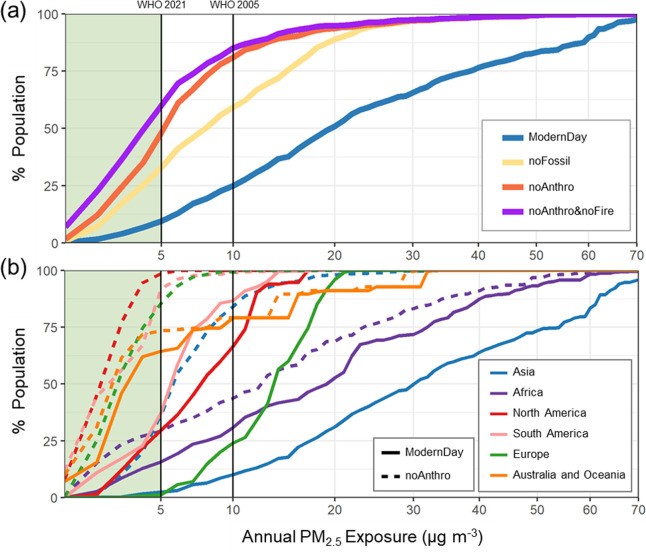
Figure 2.
Cumulative distribution functions of population exposure to annual PM2.5 segmented by (a) emission scenarios and (b) geographic location. Vertical black lines designate the 2005 and 2021 WHO PM2.5 guidelines. See Figure S7 for a distribution of average annual PM2.5 population exposures segmented by per capita national income and geographic location.

