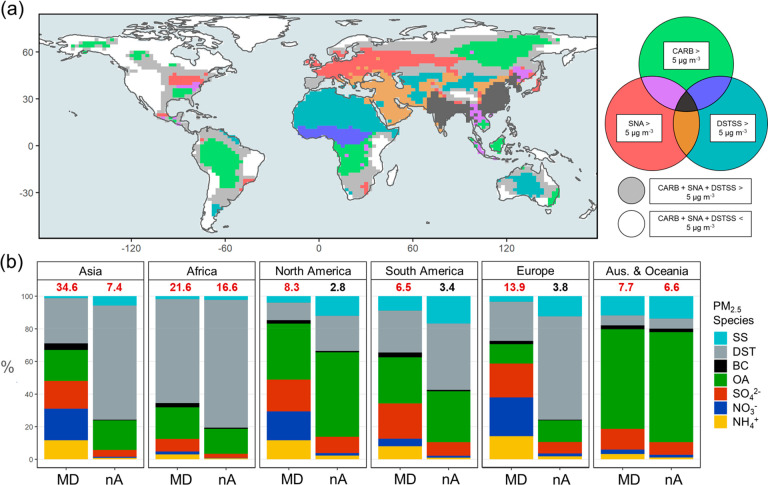
Figure 3.
(a) WHO PM2.5 exceedance plots segmented across three categories by aerosol composition classes: CARB (black carbon and organic aerosol), SNA (sulfate, nitrate, and ammonium), and DSTSS (fine dust and sea salt). The legend describes the colors corresponding to overlapping regions where multiple categories exceed the 5 μg m–3 guideline. (b) Compositional representation of population-weighted PM2.5 exposure for the modern day emission (ModernDay, MD) scenario and the extreme abatement (noAnthro, nA) scenario organized by continent. The numbers on top of each bar correspond to the population-weighted annual PM2.5 exposure for each continent (with levels that exceed the WHO guideline in red). See Figure S9 for a version of panel a with the 2005 WHO guideline of 10 μg m–3.

