Figure 10.

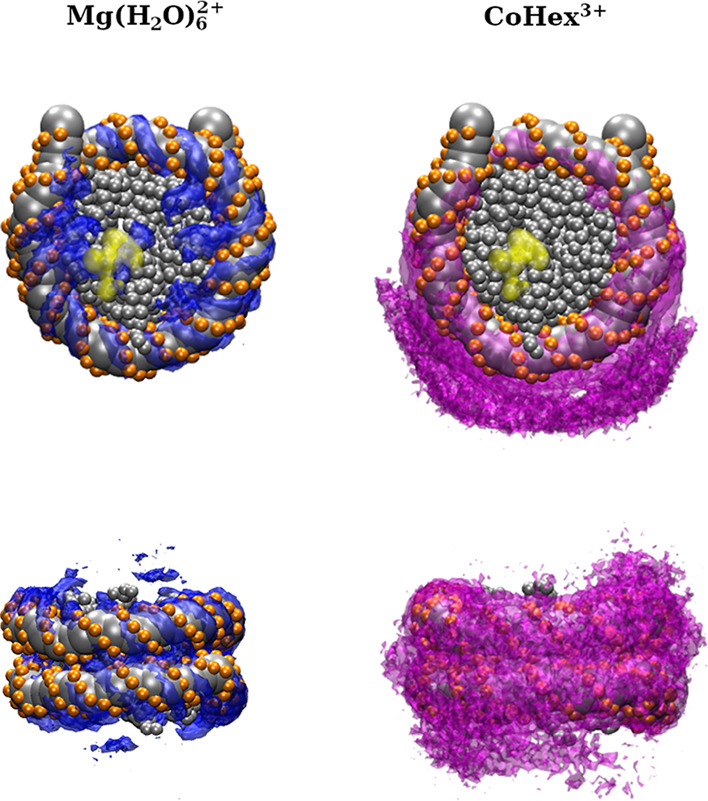
Top view (top row) and side view (bottom row) of the distribution of multivalent ions surrounding the NCP. Yellow regions in the top view panels indicate the approximate positions of the acidic patch.

Top view (top row) and side view (bottom row) of the distribution of multivalent ions surrounding the NCP. Yellow regions in the top view panels indicate the approximate positions of the acidic patch.