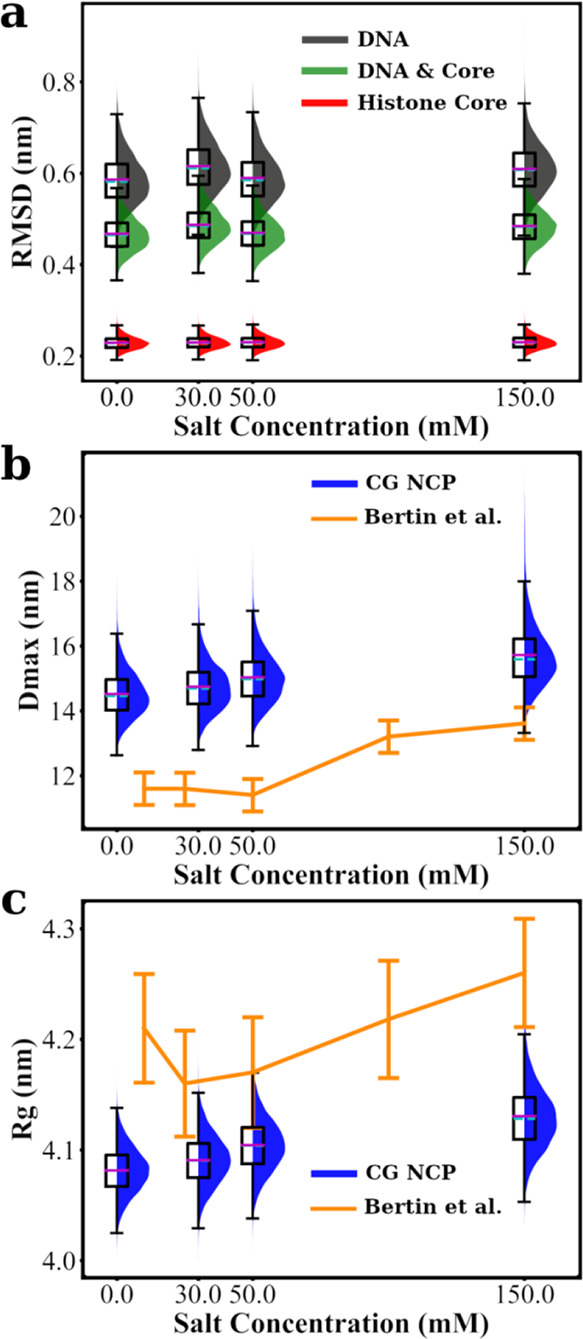
Figure 5.

Structural features of CG NCP. Structural properties obtained in equilibrium simulation of a single NCP are presented with box plots, including the RMSD relative to the crystal structure (a), maximal dimension (Dmax in b), and radius of gyration (Rg in c). The edges on each box plot represent the 25th and 75th percentile. Mean values and medians are shown as magenta and cyan lines in the boxes, respectively. Whiskers are extended for 1.5 times the interquartile range in each direction. A shaded distribution curve is plotted alongside each box to illustrate the shape of the distribution for each dataset. RMSD values are calculated and combined for DNA and histone core (as defined in Table S2). Dmax and Rg are plotted together with experimental data from ref (61). All properties are shown as functions of salt concentration.
