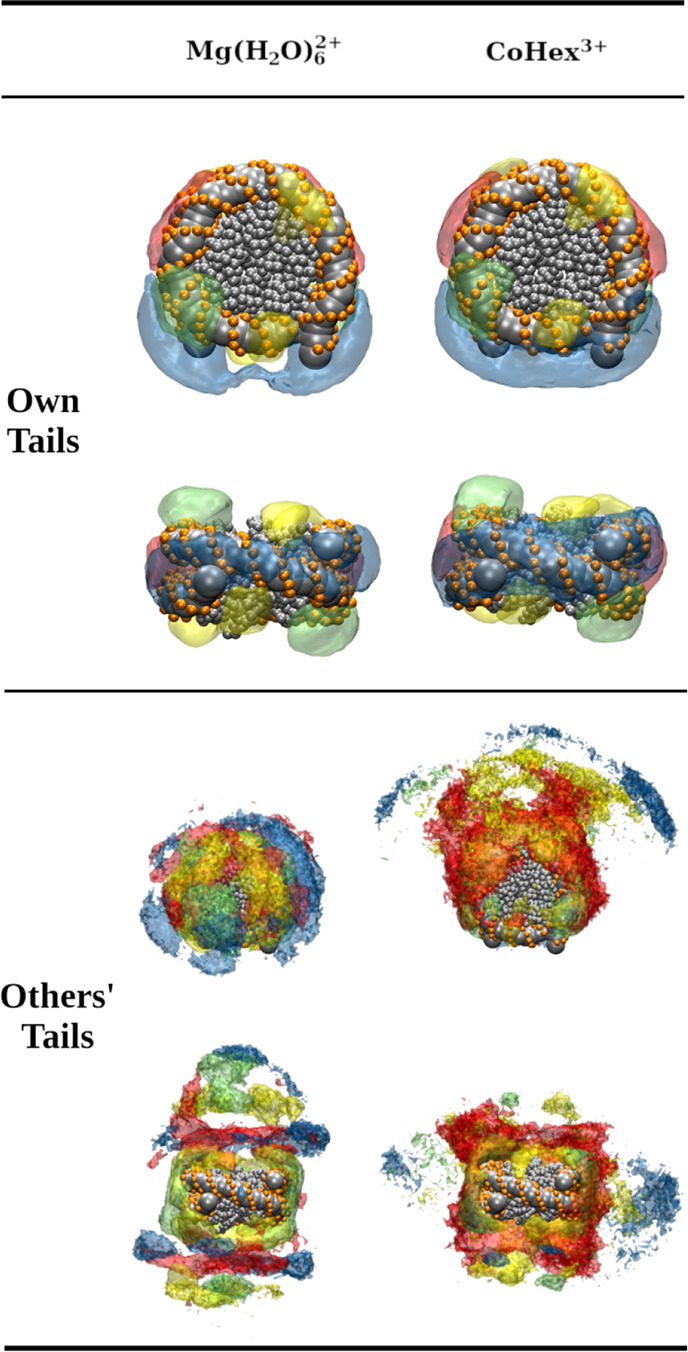
Figure 9.

SDFs of the histone tails around the NCP calculated from the equilibrated parts of the CG MD trajectories in the Mg-20NCP and Co-20NCP systems. Threshold values used to draw the transparent isosurfaces are the same for both systems. The SDFs of the H3 tails are colored blue, the H4 tails are green, the H2A tails are yellow, and the H2B tails are red; the DNA and core histone beads of the central NCP are shown as gray spheres. The top and side views of the central NCP are shown. See the Supporting Information for the 3D animation of these distributions.
