FIG 1.
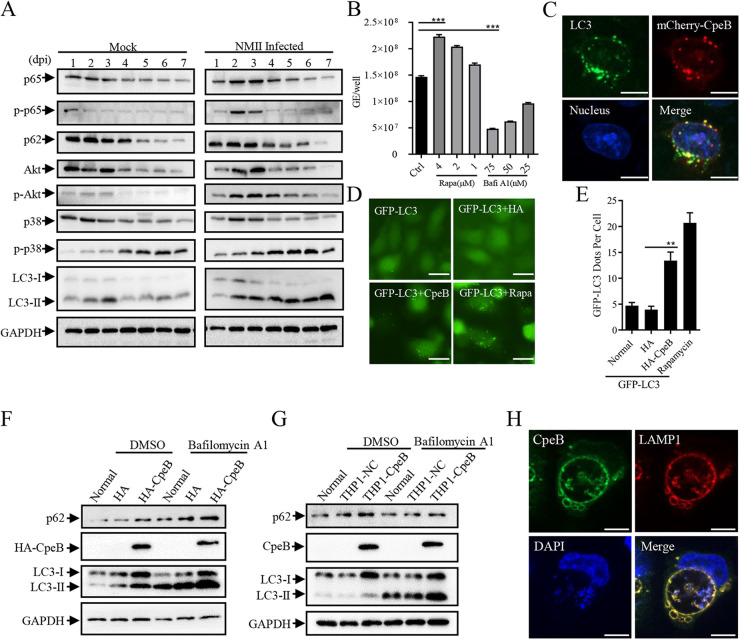
CpeB promotes the accumulation of LC3 and colocalizes on the membrane of CCVs. (A) THP-1 cells were infected with C. burnetii at an MOI of 10. At different time points (1, 2, 3, 4, 5, 6, and 7 days) postinfection, cells were lysed, and the expression of different markers, including p65/p-p65, Akt/p-Akt, p38/p-p38, p62, and LC3, was detected by Western blotting. GAPDH expression was used as an internal control. (B) Differentiated THP-1 cells (1 × 10⁶ cells/mL) were treated with rapamycin or bafilomycin A1 at the indicated concentration for 48 h after infection. Genome equivalents of C. burnetii were quantitated by qPCR at 5 days postinfection. All samples were carried out in triplicate on the same plate. (C) HeLa cells were transfected with mCherry-CpeB. Twenty-four hours later, cells were fixed, and endogenous LC3 was labeled with an anti-LC3 antibody. The colocalization of LC3 and CpeB was observed with a Nikon Eclipse Ti microscope (magnifications, ×600; bar, 10 μm). (D) HeLa cells were transfected with pEGFP-LC3 alone (normal) or cotransfected with pCMV-HA (HA) or pCMV-HA-CpeB (HA-CpeB). Rapamycin (4 μM) was used as a positive control. (E) Twenty-four hours later, the GFP-LC3 dots were observed under a fluorescence microscope (magnification, ×200; bar, 20 μm), and the number of GFP-LC3 dots per cell (n = 20) was counted. (F) HeLa cells were transfected with pCMV-HA or pCMV-CpeB. Twenty-four hours later, cells were treated with bafilomycin A1 (50 nM) or dimethyl sulfoxide (DMSO) as control for 4 h before being lysed. The expression of LC3, p62, and HA-CpeB was examined using Western blotting. GAPDH was used as an internal control. (G) THP-1, THP1-NC, or THP1-CpeB cells were pretreated with bafilomycin A1 or DMSO before collection, and then the expression of CpeB, LC3, or p62 was detected by Western blotting using anti-CpeB, anti-LC3, or anti-p62 antibodies. (H) THP1-CpeB cells were infected with WT C. burnetii at the MOI of 10. Four days postinfection, cells were fixed and labeled with anti-CpeB (green) and anti-LAMP1 (red) antibodies. Nucleic acid was stained with DAPI (blue) (magnification, ×600; bar, 10 μm). Data are representative of three independent experiments, and bars represent the mean ± SD of three independent experiments. Significances are represented as follows: ***, P < 0.001; **, P < 0.01; and *, P < 0.05.

