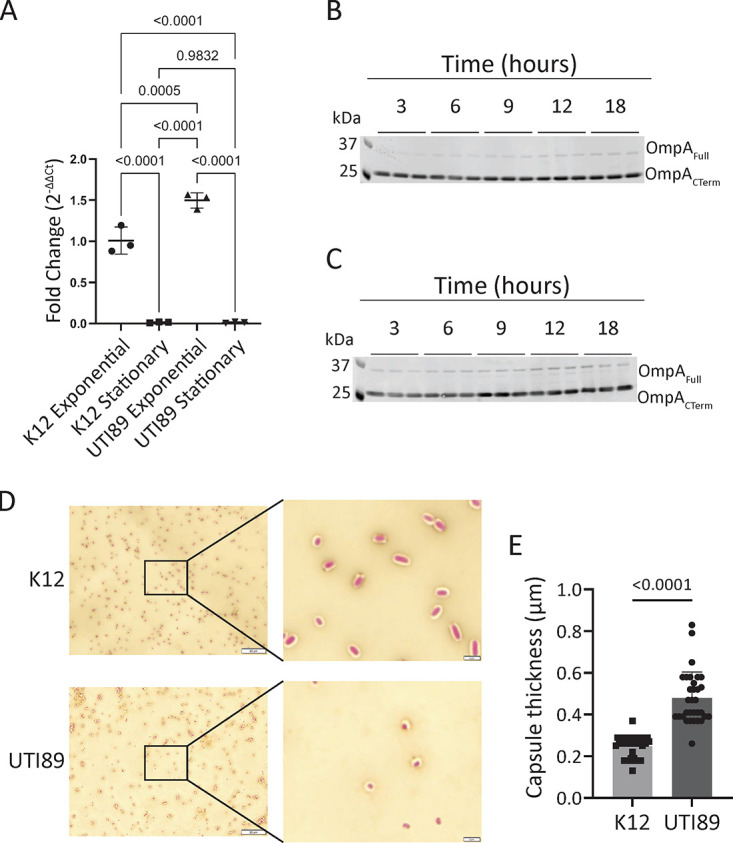
FIG 3.

Neither ompA mRNA transcript levels nor OmpA protein expression levels explain binding differences between K-12 and UTI89 E. coli, but UTI89 produces more capsule. (A) Transcript-level expression of ompA by RT-qPCR normalized to 16S housekeeping gene expression relative to exponential-phase K-12 E. coli. RT-qPCR was analyzed by one-way ANOVA. Error bars show standard deviation. Data are representative of two independent experiments. Protein level expression of OmpA by immunoblot to K-12 (B) or UTI89 (C) E. coli. Two bands representing two forms of OmpA are observed; based upon molecular weight, they are predicted to be two forms of OmpA. Data are representative of three independent experiments. (D) Maneval’s capsule staining of K-12 or UTI89. Background is counterstained with Congo red, and cells are stained with Maneval’s solution. Images were taken with a 100× objective, the primary image scale bar is 20 μm, and the inset scale bar is 2 μm. (E) The zone of stain exclusion by capsule was measured from eight cells in three independent replicates. Data were pooled, each data point represents one cell, data were analyzed by Mann-Whitney U test, and error bars show standard deviation.
