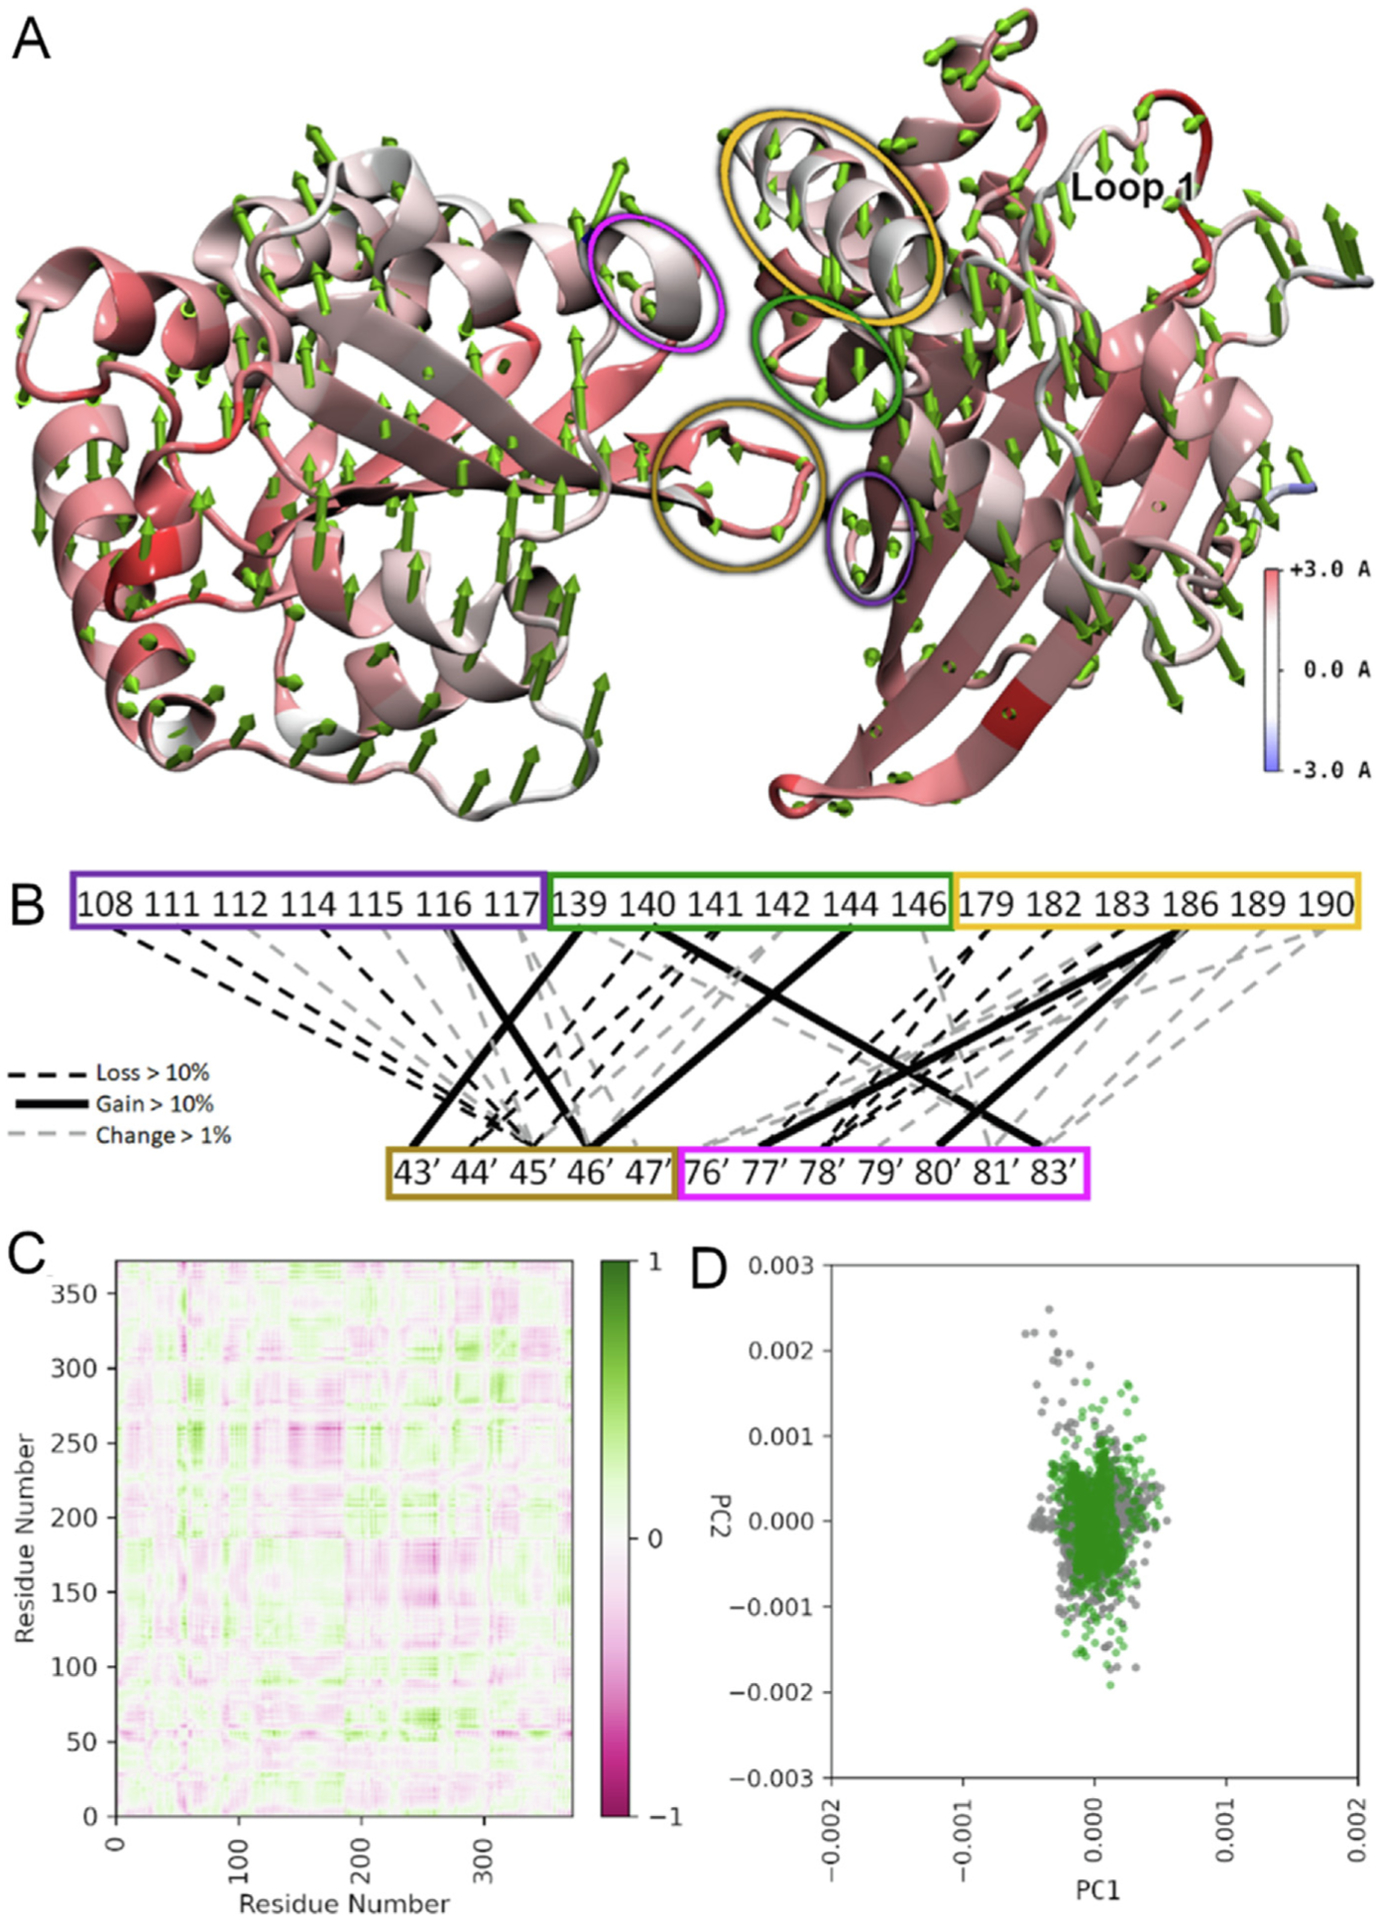
Figure 7. Model analysis of hA3C R44Q/R45H/A144S shows large changes in specific conformations.

The hA3C R44Q/R45H/A144S variant compared to hA3C WT. (A) RMSF heatmapped to the protein structure with first normal mode shown as arrows from each amino acid in sequence. Normal modes were calculated based on the motion of the α-carbon to eliminate disproportionate contributions from amino acid side chains. Arrow direction shows the motion of each residue as a portion of the total largest contributor to essential motion. Arrow size denotes magnitude of motion. The RMSF heatmapping shows the total fluctuation of each residue from an average position over the trajectory. Higher values of RMSF indicate greater movement from this average position. Loop 1 that is important for activity is labeled. (B) Dimer interface hydrogen bonding changes. Colored blocks of residues correspond to regions encircled in panel (A) with same color. Black hatched lines mean a loss >10%, black lines mean a gain of >10%, and grey hatched lines mean a change of >1%. (C) Difference correlation plot between hA3C R44Q/R45H/A144A and hA3C WT. (D) PCA showing first two modes of hA3C R44Q/R45H/A144A (green) against hA3C WT (grey).
